Navigate in Wazuh
Wazuh is Cloudaware HIDS application built on Kibana platform. The Breeze agent needs to be installed before access to Wazuh is provided in Cloudaware Launcher.
The following modes are available for interaction with the data in Wazuh:
Dashboard UI
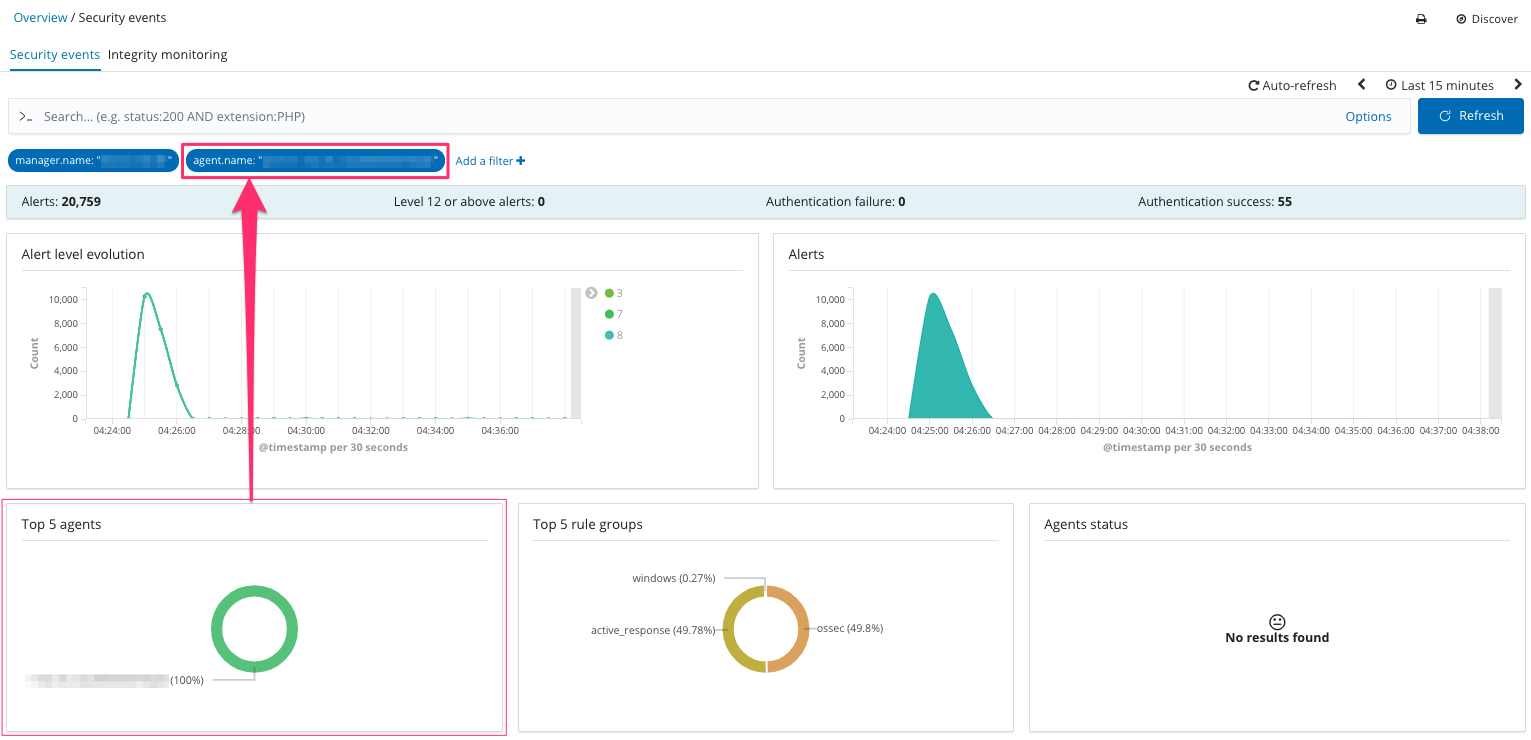
Security Events
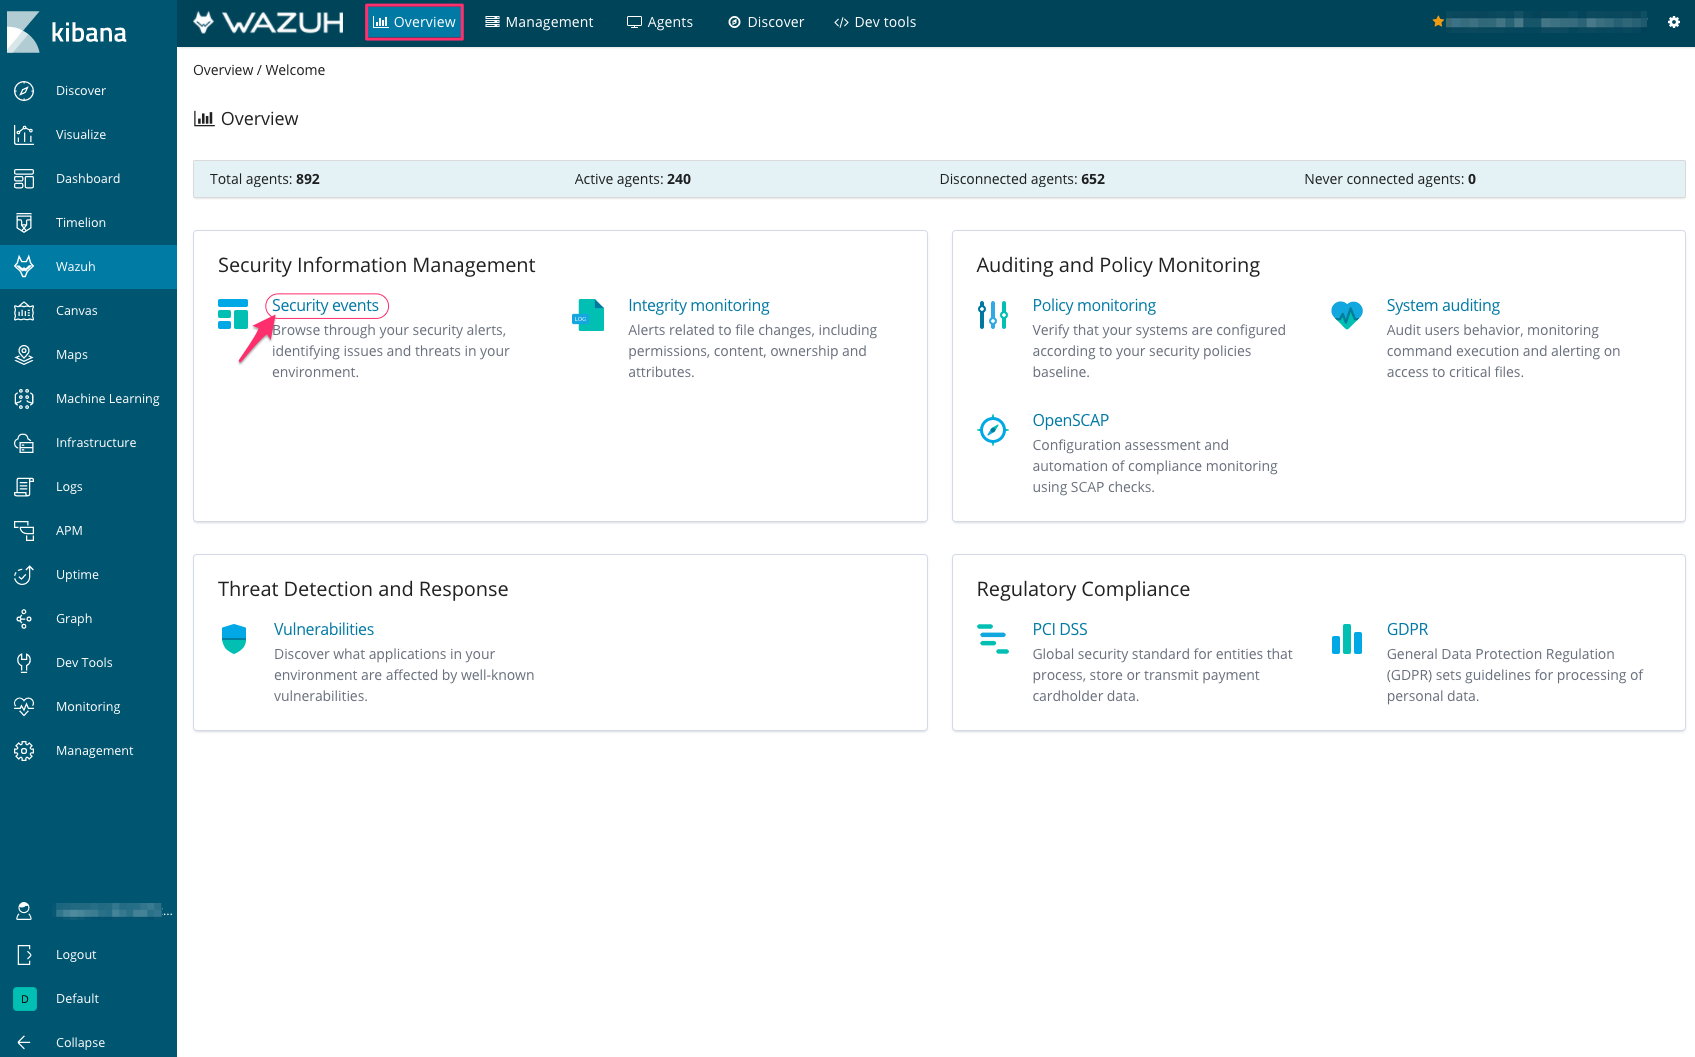
Under the tab 'Overview' locate the section 'Security Information Management'. Select Security Events to open the dashboard.
The dashboard consists of several charts:
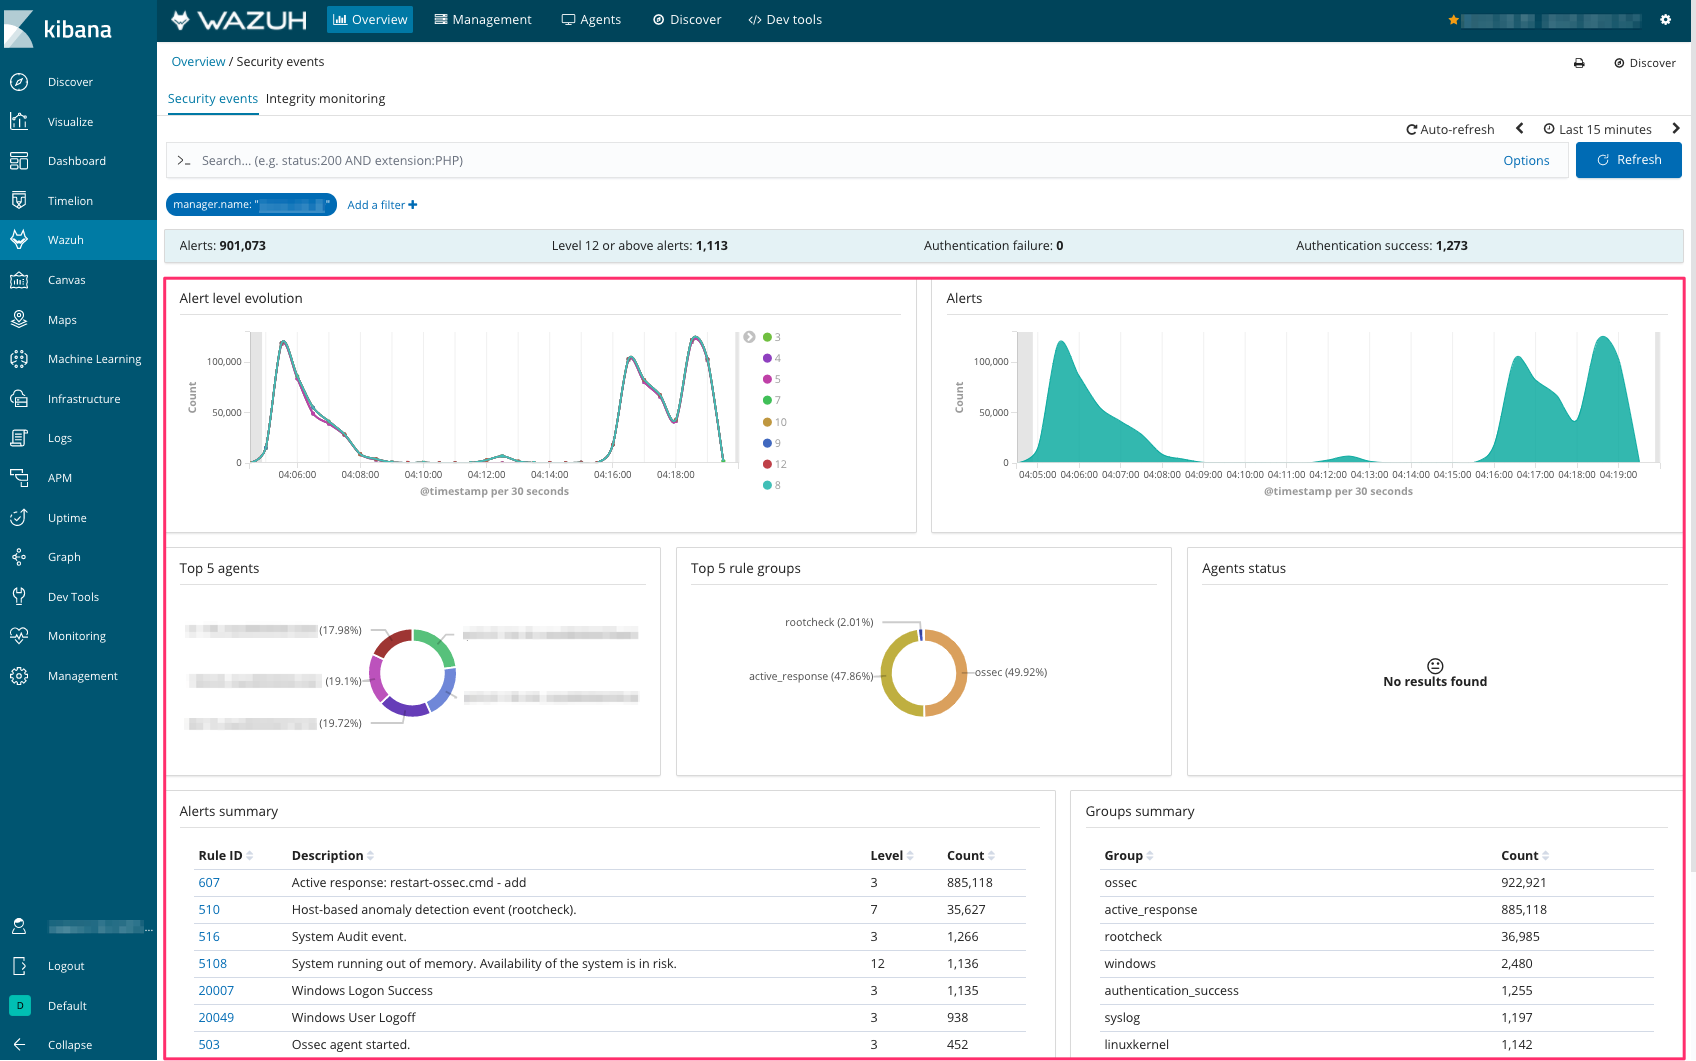
Alert level evolution
The chart displays IDS events by severity level over time. Read more about levels
Alerts
The chart displays the count of alerts over time.
Top 5 agents
The chart displays servers with Breeze that have the biggest count of alerts. Click on the host on the donut or pick the one in the list - the dashboard will be updated showing the data related to this selected host.
Note that a Wazuh agent can be identified by ID of the instance it was registered with, thus agents names can be changed.
Top 5 rule groups
The chart displays rules by groups.
Agents status
The charts demonstrates the health status of agents.
Alerts summary
The chart shows the pivot table of rules with 'Rule ID', 'Description', 'Level' (1-12, OSAC) and 'Count' columns. By clicking the arrows near the column names, you can sort alerts display in ascending or descending order.
Groups summary
The chart shows the pivot table of rule groups with 'Group' and 'Count' columns. By clicking the arrows near the column names, you can sort groups display in ascending or descending oder.
Time Picker
Use time picker in the upper right corner to select the time period for viewing events in question.

Search
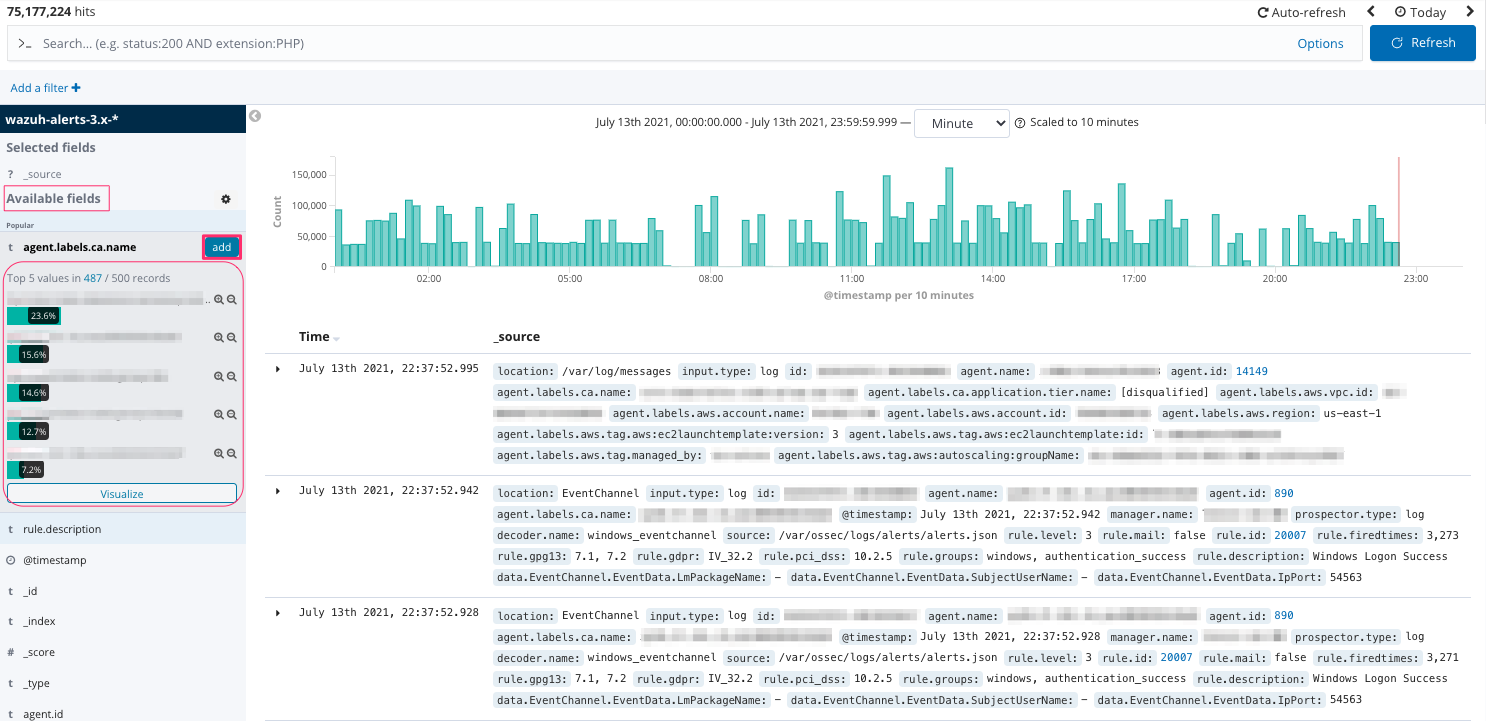
Refer to the list of available fields on the left. Click on a field to expand details about its top-5 values. Click Add to add the field as a column into the log display table on the right to analyze data:
Filters
The following options can be used for filtering the information on the dashboard:
1. Click a chart element on the dashboard to add it as a filter.
2. Click Add a filter and select a field, an operator and a value manually. Click Save.

Hover the mouse on the filter to view additional options. You can disable filter(1), pin filter(2), exclude matches(3), remove filter(4) or edit filter(5):

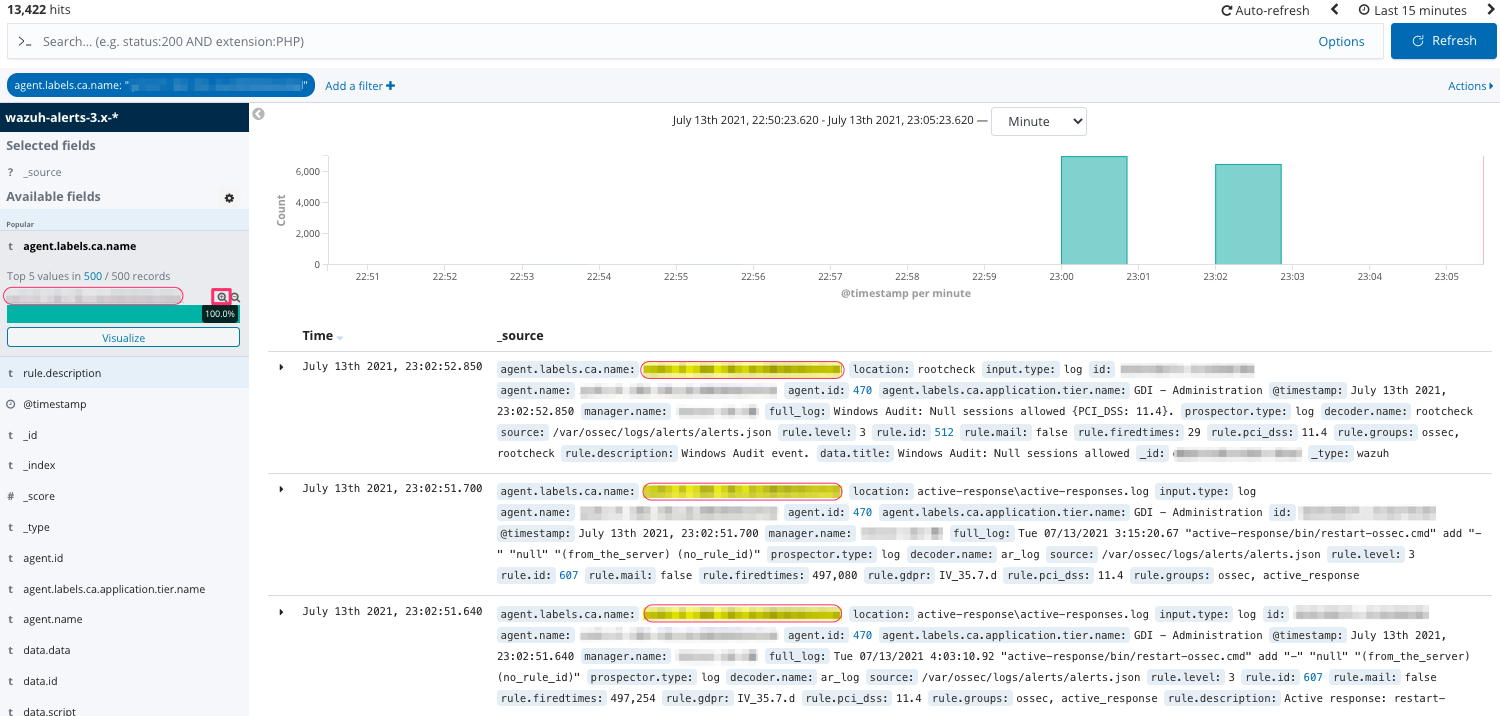
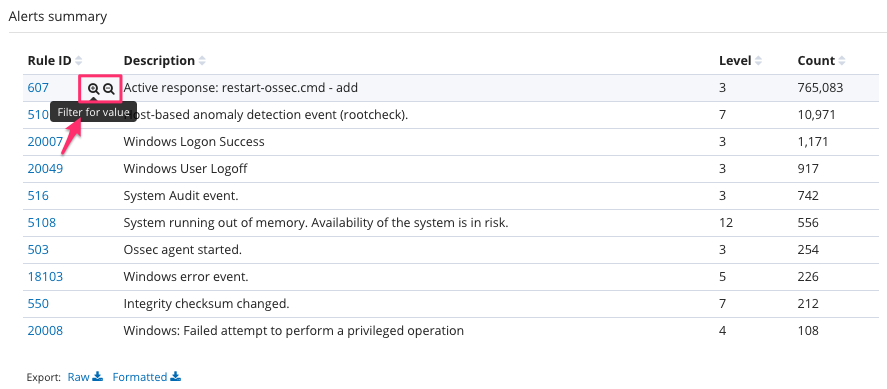
3. Hover mouse to the values in the table charts to locate 'zoom in' and 'zoom out' icons. For example, click 'zoom in' near a rule ID to view all related events:
File Integrity Monitoring
Under the tab 'Overview' locate the section 'Security Information Management'. Select Integrity Monitoring to review important changes that occur on hosts specifically.
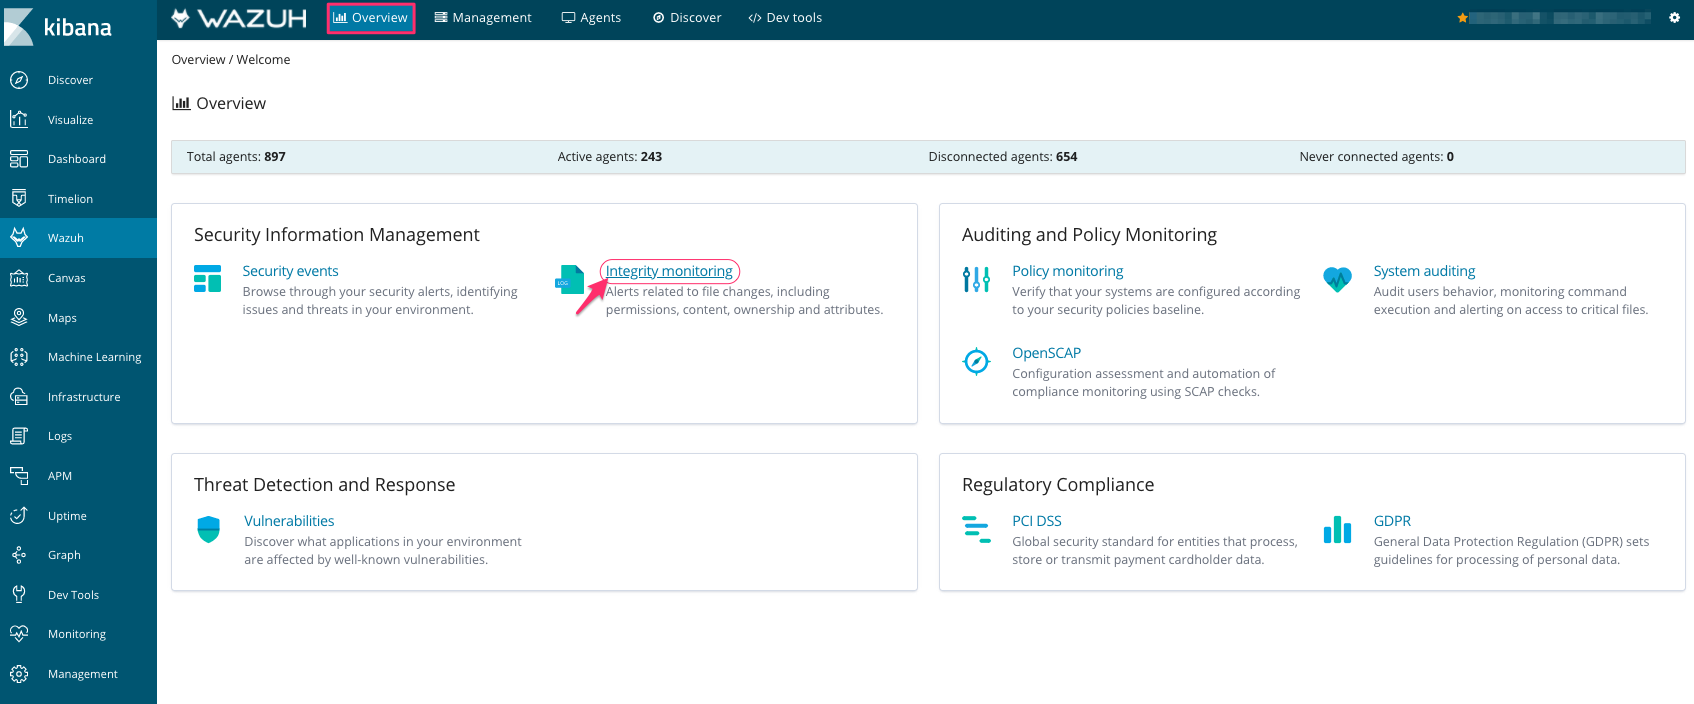
FIM keeps track of everything relevant and critical to the operating system (config files, binaries, patch installation, software upgrade, etc) monitoring events in real time.
Raw Data UI
Go to the tab 'Discover' to open events row data for a more profound investigation.
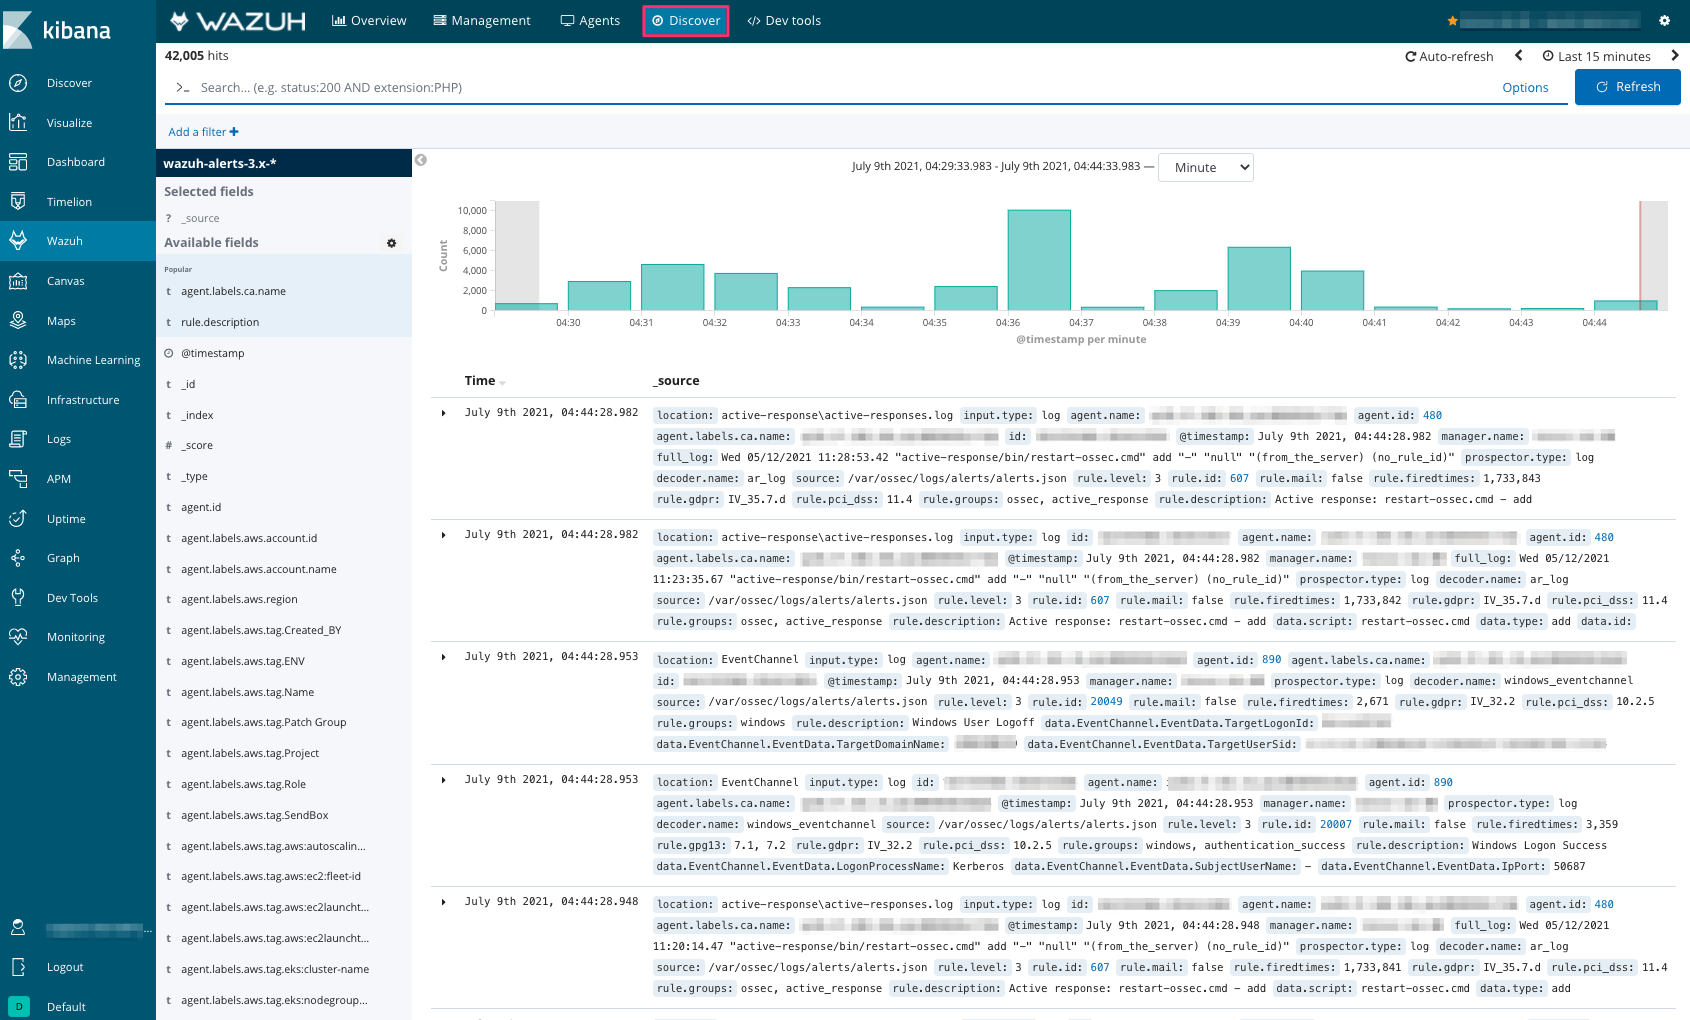
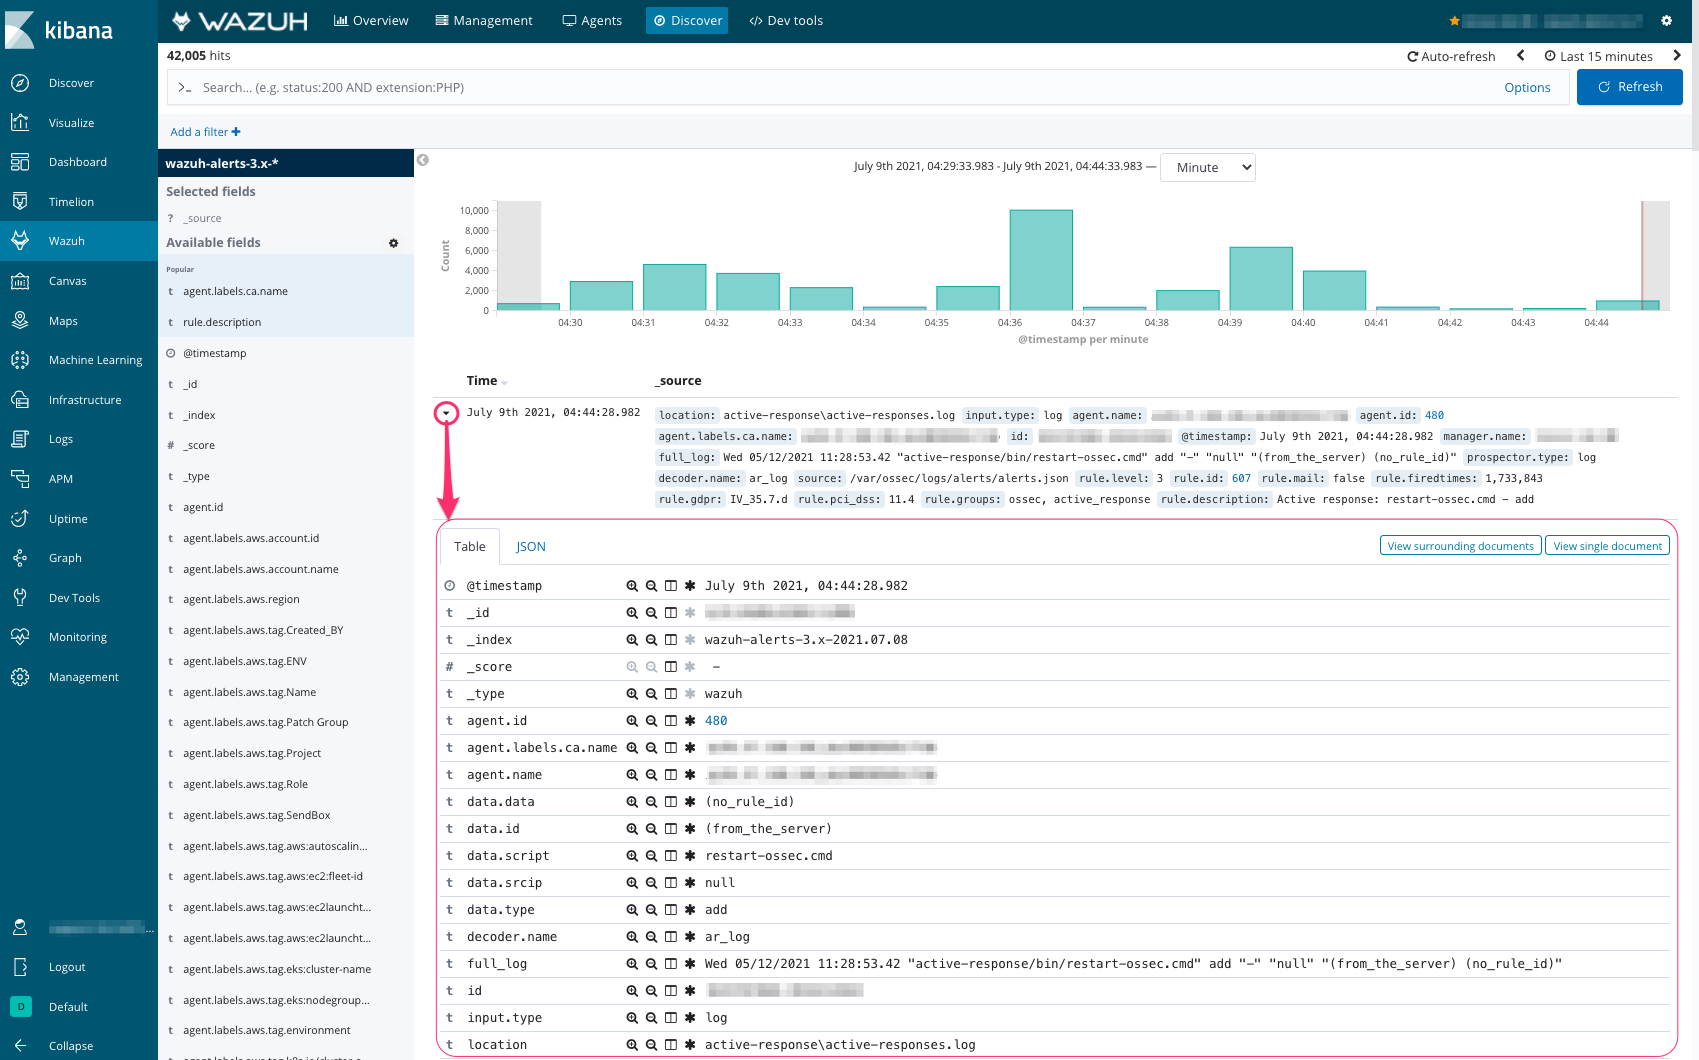
Scroll down to select the event in question. Click the 'arrow' icon to expand the details:
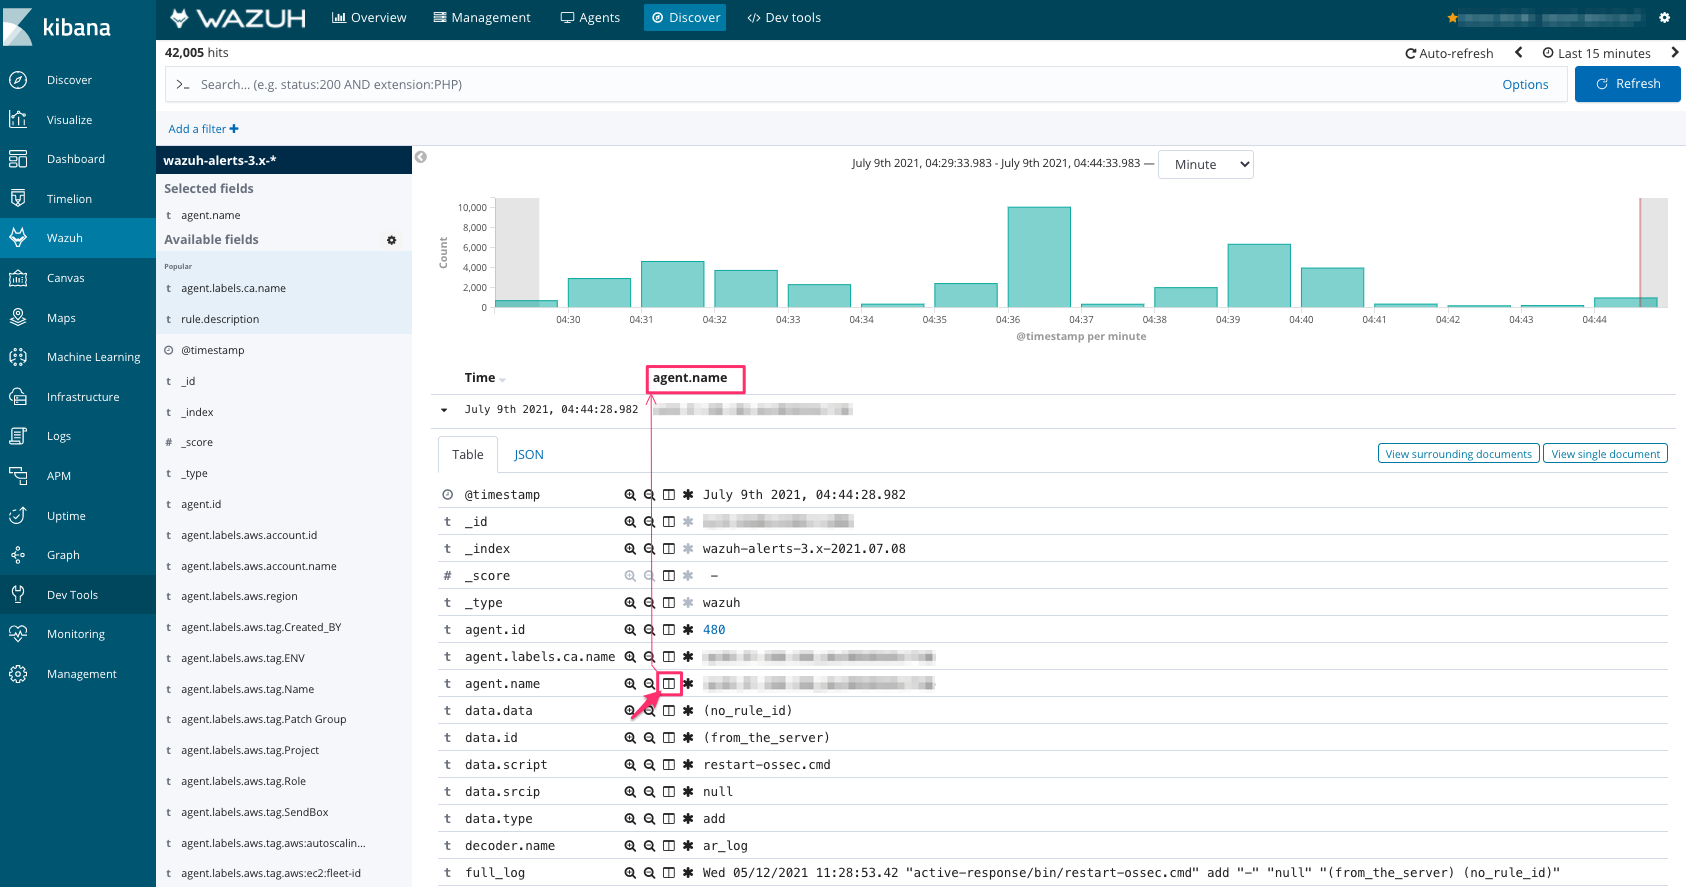
Click the 'open book' icon near a string to have it added as a column in a table mode:
Click on a trend chart to zoom into any specific time period you would like to investigate, even to a few seconds period.
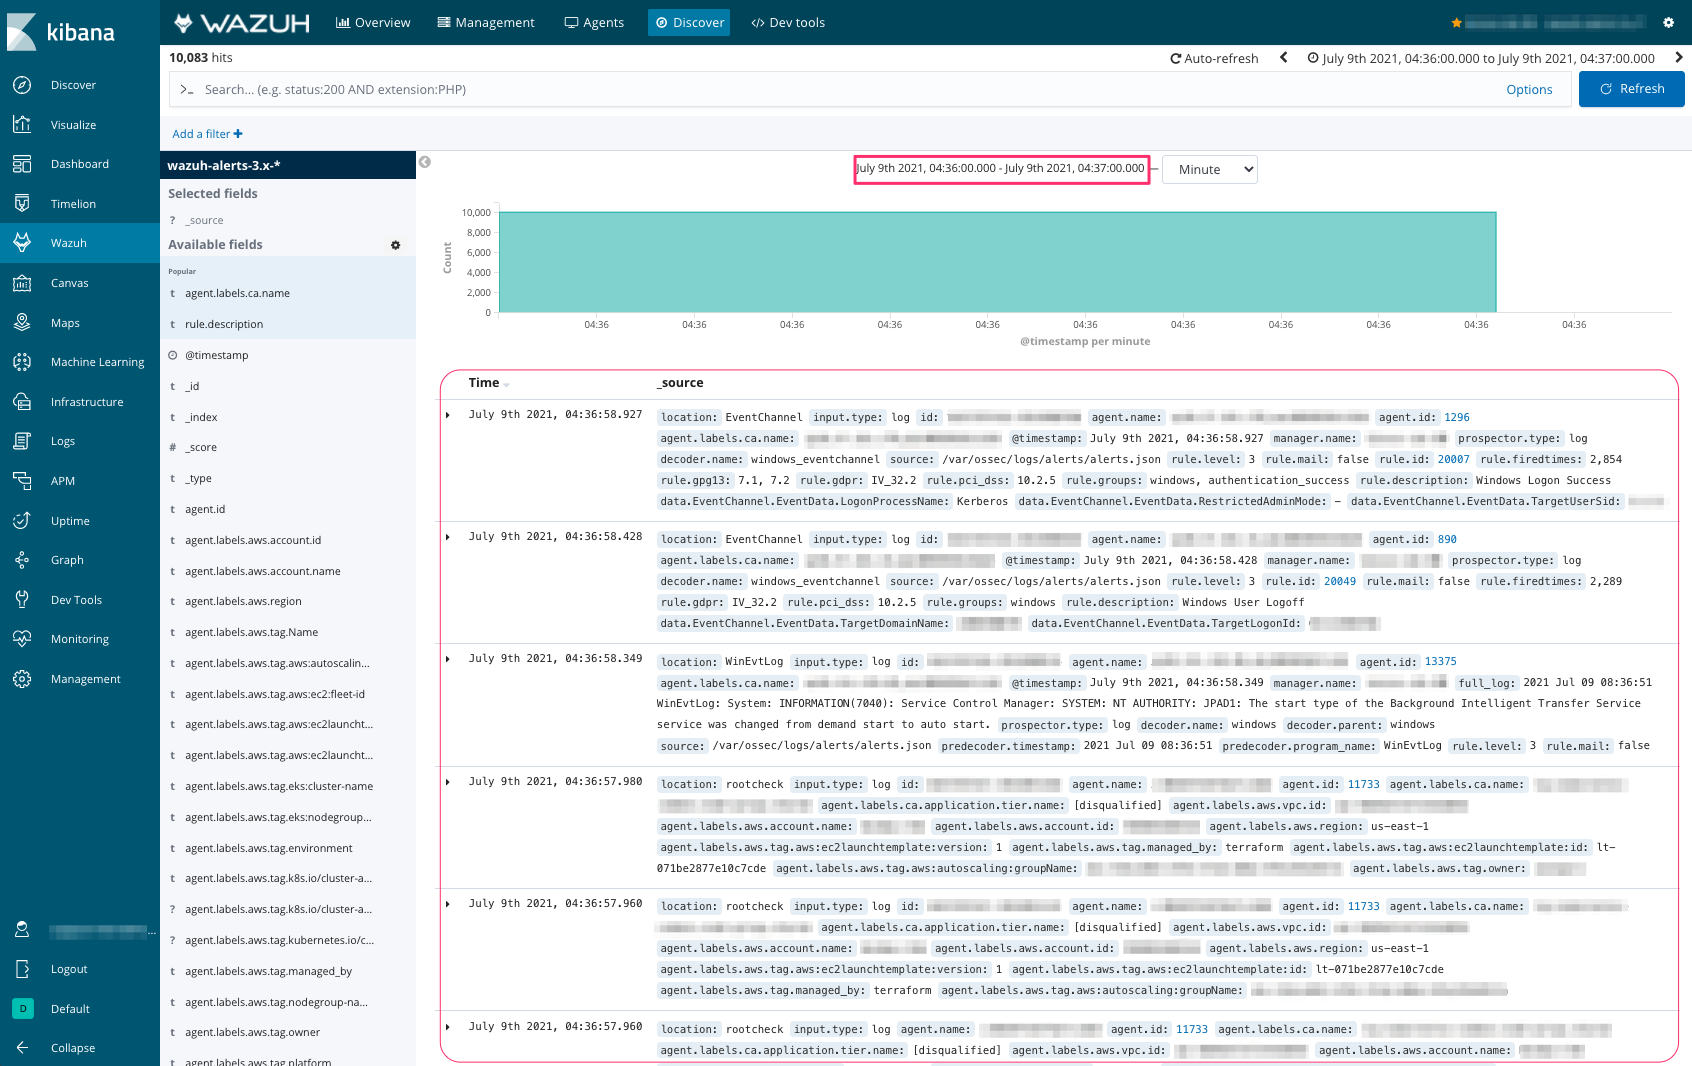
To undo zooming, go to the time picker in the upper right corner, click the tab 'Quick' and select a different time period.
Filters
In row data UI you can add filters by clicking 'zoom in' and 'zoom out' icons or add them manually. For example, locate a field in the list on the left. Click 'zoom in' to filter by this value. As a result, the value in question will be highlighted yellow:
