Health & Status
Use this guide to validate Breeze Agent health, confirm host check-ins, review scheduler and log status, and troubleshoot unhealthy or stale hosts.
Check Agent Health on the Host
Linux and macOS
- Verify the scheduler:
systemctl status breeze-agent.timer(preferred), orcat /etc/cron.d/breeze-agentfor cron‑based setups.
- Check recent runs:
journalctl -u breeze-agent.service --since "15 minutes ago"(if using systemd units), or- Inspect
/opt/breeze-agent/var/log/breeze-agent.logfor the latest entries.
Windows
- Open Task Scheduler and verify:
- Task
Breeze Agentexists. Last Run TimeandLast Run Resultshow successful, recent runs.
- Task
- Confirm logs at
C:\\Program Files\\Breeze\\agent.logare updating on the expected cadence.
Check Breeze Health in Kubernetes
Verify the Breeze DaemonSet:
- Run
kubectl get ds -n <namespace>and confirm thatDESIRED,CURRENT, andREADYmatch. - Run
kubectl logs -n <namespace> <breeze-pod>and check for recurring errors.
Check Agent Status in Cloudaware
In Cloudaware CMDB:
- Use the default list views (for example, BREEZE: ACTIVE) on servers and Kubernetes nodes to:
- Filter assets by the
Breeze: Last Updatecolumn in the view. - Copy the default view, adding the filter 'Breeze Is Active' equals
FALSE. Identify stale or never‑seen hosts.
- Filter assets by the
Investigate Unhealthy or Stale Hosts
If a host is not reporting as expected:
- Verify OS‑level scheduling (timer/cron or Task Scheduler) and logs on the host.
- Confirm outbound HTTPS connectivity to
breeze-server.cloudaware.com(and proxies, if used). - Check configuration and tags:
- Ensure the agent certificate is valid and not expired.
- Confirm tags and descriptors are set as expected in
etc/tagsor env files.
- Use the guidance in Troubleshooting for common failure patterns.
Breeze Adoption Dashboard
Use the Breeze Adoption Dashboard to track Breeze Agent deployment progress across cloud providers, accounts, environments, and ownership groups.
The dashboard provides a consolidated view of Breeze Agent deployment, coverage, and adoption across cloud providers, accounts, environments, products, and server ownership dimensions. It helps users identify servers without active Breeze coverage, monitor changes in agent adoption, and determine which infrastructure segments require deployment or remediation.
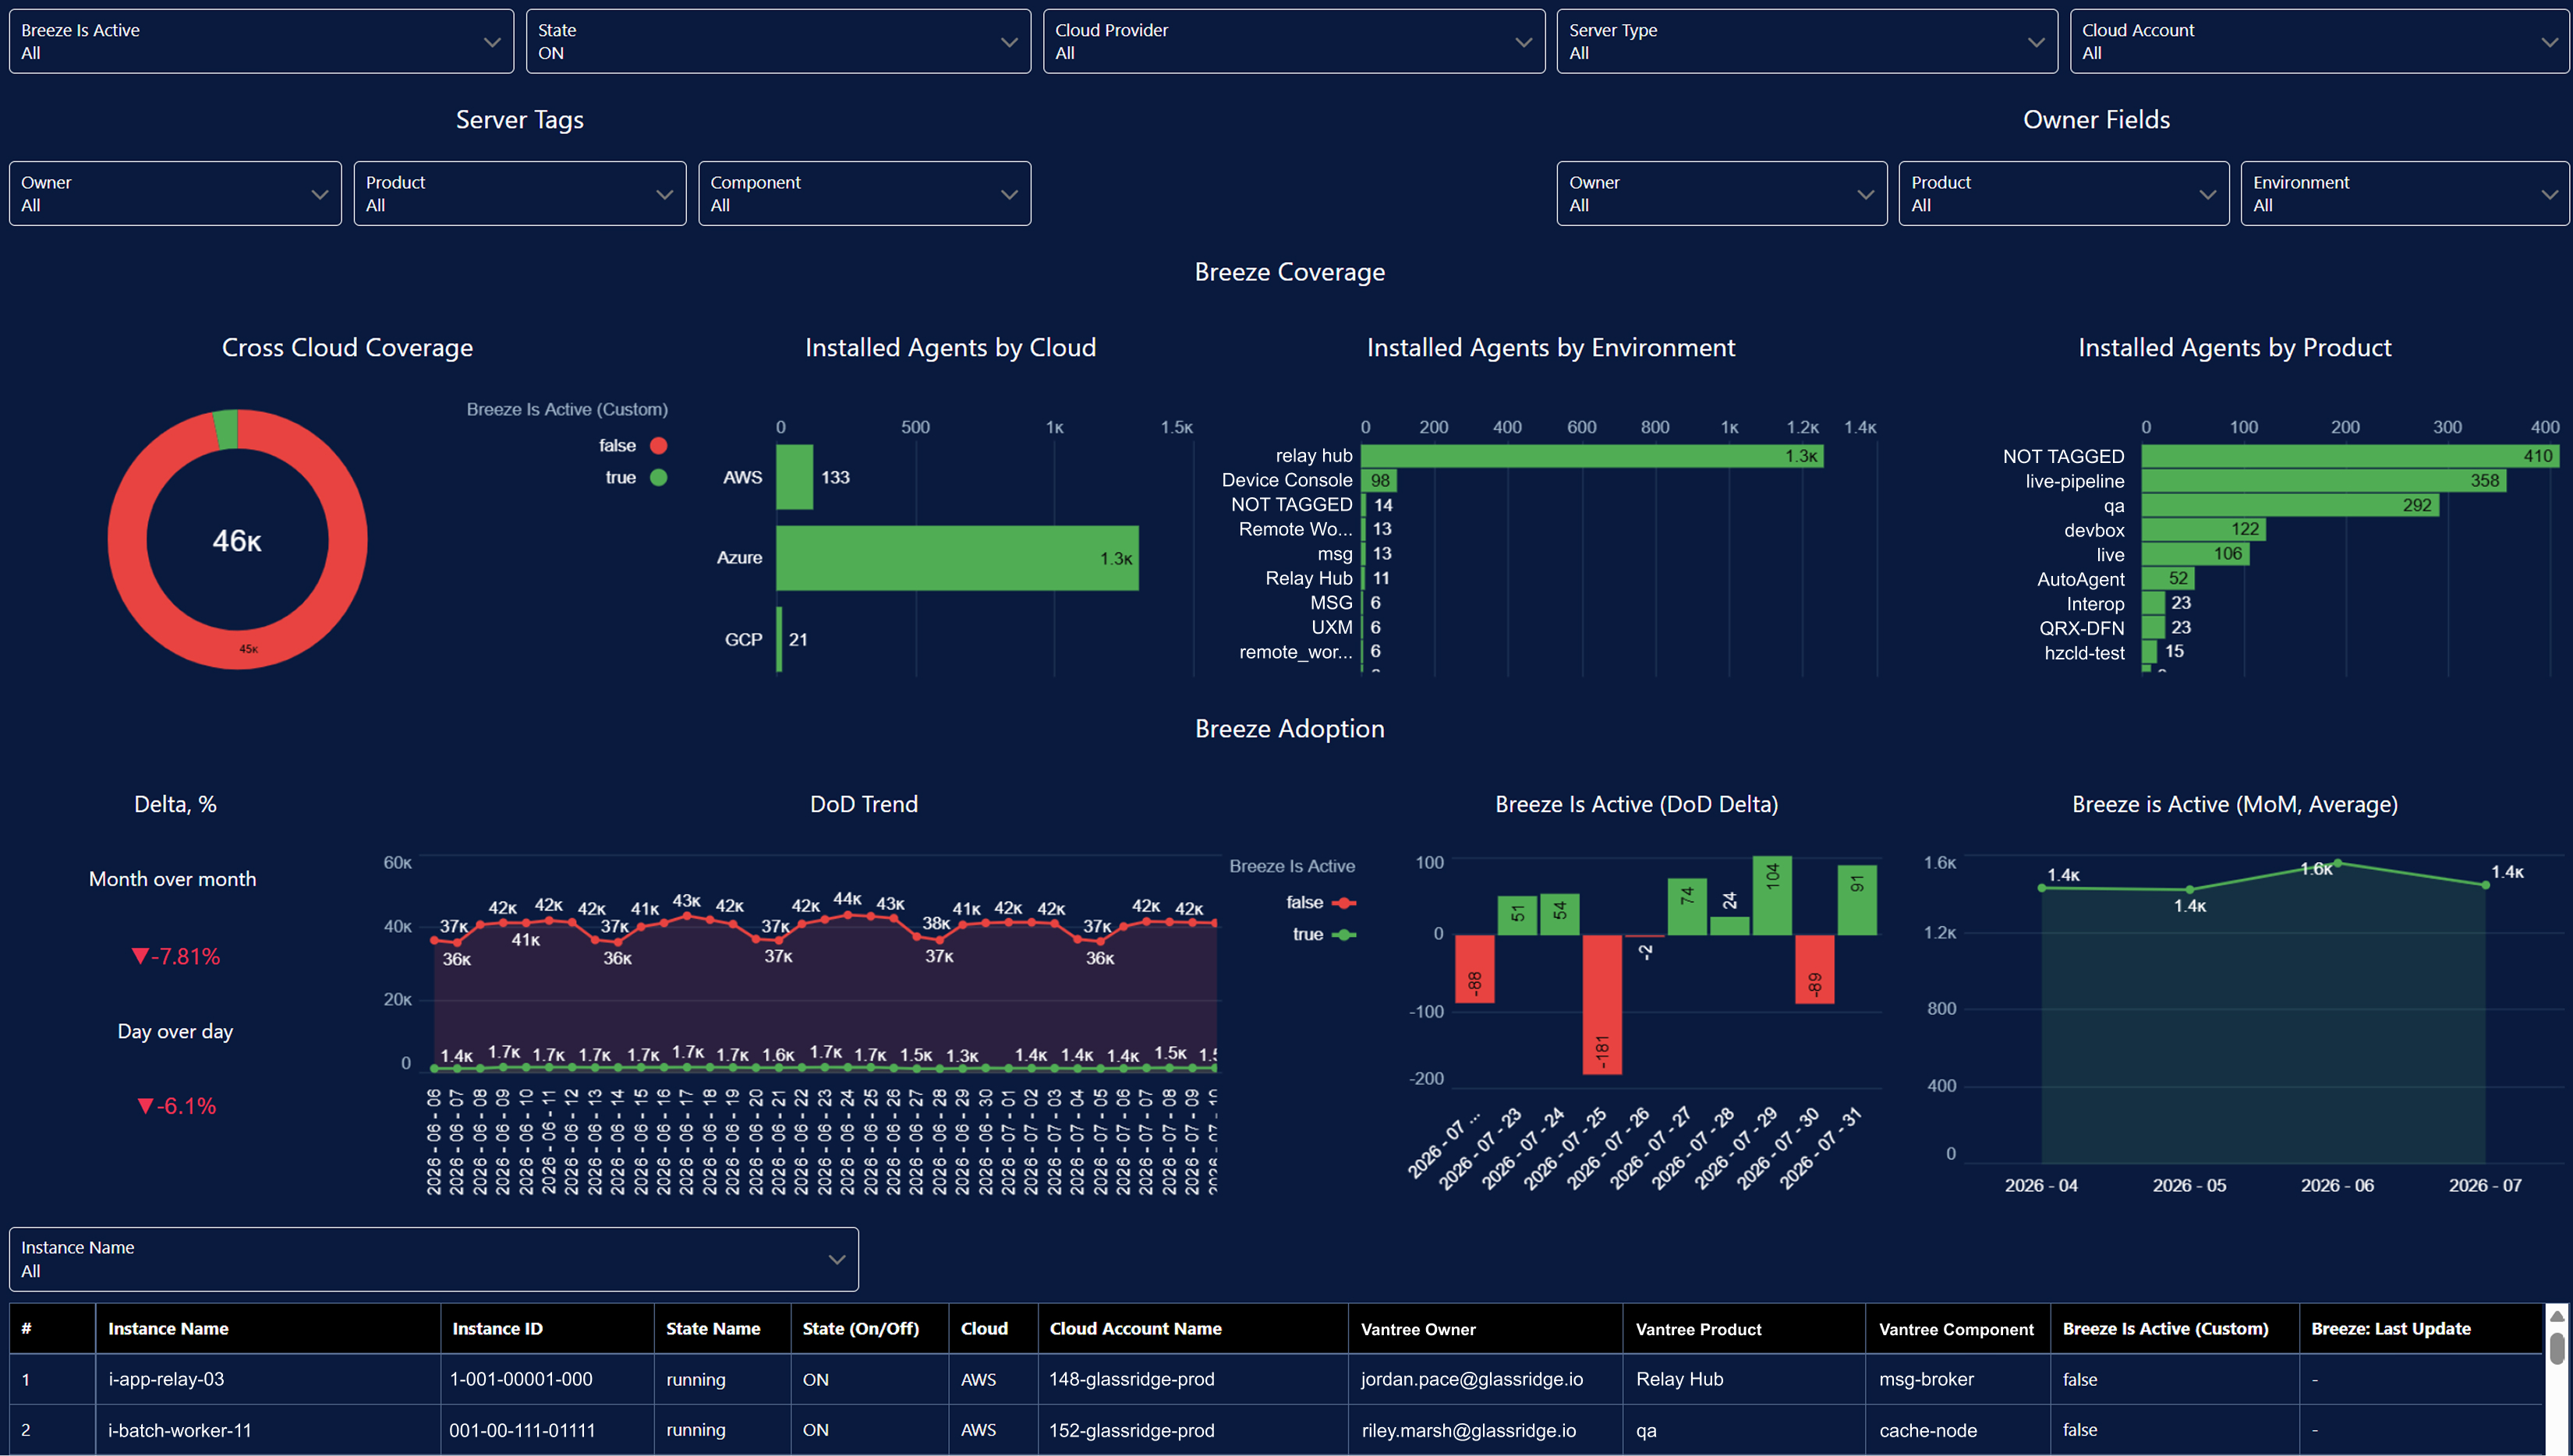
The top section contains filters for narrowing the dashboard by:
- Breeze active status
- Server state
- Cloud provider
- Server type
- Cloud account
- Server tags, including owner, product, and component
- Cloudaware owner fields, including owner, product, and environment
The main visual panels are organized into two sections.
Breeze Coverage
- Cross Cloud Coverage: A donut chart shows the total number of servers divided between systems with and without an active Breeze Agent. This provides an immediate view of overall agent coverage and the remaining deployment gap.
- Installed Agents by Cloud: A horizontal bar chart shows the number of active Breeze Agents by cloud provider, such as AWS, Azure, and Google Cloud. This helps users compare adoption across providers and identify clouds with comparatively low coverage.
- Installed Agents by Environment: A ranked bar chart shows active Breeze Agent installations by environment. This helps users determine whether coverage is concentrated in particular environments and identify production or non-production environments that may require additional deployment.
- Installed Agents by Product: A ranked bar chart shows active Breeze Agent installations by product. Application and platform teams can evaluate coverage across product portfolios and identify products with incomplete agent adoption.
Breeze Adoption
- Delta, %: KPI indicators show the percentage change in active Breeze coverage month over month and day over day. Negative values indicate a reduction in the number of active agents, while positive values indicate increased adoption.
- DoD Trend: A daily trend chart compares servers with active Breeze Agents against servers without active agents. This helps users monitor the overall installed base, identify sudden changes, and determine whether the uncovered server population is increasing or decreasing.
- Breeze Is Active (DoD Delta): A daily delta chart shows changes in the number of servers with and without active Breeze Agents. Positive and negative bars highlight daily additions, removals, activations, or losses of agent coverage.
- Breeze Is Active (MoM, Average): A monthly trend chart shows the average number of servers with active Breeze Agents. This provides a higher-level view of adoption stability and longer-term growth or decline.
For users, the value is in the following areas:
- Visibility into Breeze coverage. Users can see how many servers are protected or monitored through Breeze and how many remain uncovered.
- Identification of deployment gaps. Breakdowns by cloud, environment, product, account, and owner help teams locate infrastructure segments where Breeze is missing or inactive.
- Adoption monitoring. Daily and monthly trends show whether Breeze deployment is expanding, remaining stable, or declining.
- Detection of coverage regressions. Delta metrics make sudden losses of active agents visible, helping teams investigate server removal, connectivity issues, agent failures, or configuration changes.
- Ownership and remediation. Server-level details and ownership dimensions help route uncovered or inactive systems to the appropriate application, product, or infrastructure team.
- Support for operational governance. The dashboard provides evidence for validating Breeze deployment requirements and tracking adoption across the organization.