Report & Dashboard Gallery
This document provides example dashboards and reports by persona and module.
Use the KPI definitions to standardize metrics across views, and refer to export formats for sharing data with BI/finance systems.
Building Blocks
To create consistent dashboards and reports, focus on the following building blocks:
-
Filters and Scopes.
Standardize saved views that narrow dashboard data by environment, account, subscription, team, application, or business unit. -
Shared Datasets.
Create curated or pre-aggregated datasets that can be reused across multiple dashboards, such as cost by application per month or compliance findings by team. -
Ownership Mapping.
Ensure metadata is available to associate resources, findings, alerts, and costs with the appropriate owner, such as a team, application, service, or cost center.
KPI Definitions
Example KPIs for reporting/dashboards in Cloudaware:
-
Control Pass Rate — Compliance
- Definition: Passed findings divided by total findings evaluated during the reporting period.
- Formula:
Passed findings/Total evaluated findings - Filters: Environment, account/subscription, application, team.
-
MTTR — Compliance Remediation
- Definition: Average time from finding creation to the point when the finding status is set to
remediatedorclosed. - Formula:
Total remediation time/Number of remediated or closed findings - Notes: Exclude suppressed findings and approved exceptions from the calculation.
- Definition: Average time from finding creation to the point when the finding status is set to
-
Tag Coverage
- Definition: Resources with the required tag set divided by the total number of resources in scope.
- Formula:
Resources with required tags/Total in-scope resources - Required Keys:
owner,app,env - Notes: Required tag keys should be customized based on organizational tagging standards.
-
Patch Compliance
-
Definition: In-scope endpoints patched within the defined SLA divided by the total number of in-scope endpoints.
-
Formula:
Endpoints patched within SLA/Total in-scope endpoints -
SLA: Severity-based remediation windows, such as 30, 60, or 90 days.
-
Unit Cost
-
Definition: Total cost divided by the selected cost driver, such as application, environment, or workload.
-
Formula:
Total cost/Cost driver -
Data Requirements: Cost allocation model, including tags, business mappings, and shared-cost allocation rules.
-
Report Library
Example reports in Cloudaware:
Breeze Coverage
- Audience: Cloud governance, security operations, infrastructure, and platform owners
- Filters: Breeze Installed is true/false, EC2 Instance Deleted From AWS is blank (= not deleted), EC2 Instance State Name equals running
This report gives recipients visibility into running AWS EC2 instances and whether they are covered by Breeze. By showing active instances across all AWS accounts, along with Breeze installation status and last update details, the report helps teams identify coverage gaps, confirm monitoring or agent presence, and prioritize follow-up on instances that may not be covered or reporting correctly.
Upgradable Security Packages
- Audience: Security operations, vulnerability management, infrastructure, and platform owners
- Filters: Package Installed Date is all time, EC2 Instance Deleted From AWS is blank (= not deleted), EC2 Instance State Name equals running, Security equals True, Installed Date is blank
This report gives recipients visibility into security-related Linux packages on running AWS EC2 instances that have available upgrades. By focusing on active, non-deleted instances and packages flagged as security-relevant, the report helps teams prioritize patching, reduce vulnerability exposure, identify affected instances and accounts, and track packages that may require remediation.
High Severity CE Policy Violations
- Audience: Compliance, security operations, cloud governance, and platform owners
- Filters: Severity equals High, Close Date is blank/open, Close Date is all time
This report gives recipients a focused view of unresolved high-severity compliance issues that may require remediation or escalation. By surfacing only open high-risk violations, it helps teams prioritize security and compliance work, track aging findings, identify responsible cloud accounts or policies, and reduce exposure from misconfigurations such as IAM key rotation issues.
Dashboard Library
Example analytics dashboards in Cloudaware:
OS Service Coverage
- Audience: Cloud operations, platform engineering, security/compliance teams, infrastructure owners, and application/service owners.
- KPIs: OS service deployment counts, installed vs. not-installed coverage %, agent installation status, service status, service version, VM state, and coverage by cloud provider, account, product, owner, environment, and component.
- Inputs: Cloud instance inventory, VM state, cloud account metadata, OS service/agent discovery data, agent installation status, service version, Breeze status, ownership mapping, product metadata, environment tags, and component tags.
The OS services coverage dashboard focuses on visibility into required service and agent deployment across the cloud infrastructure estate. It is designed for operations, platform, security, and application teams that need to measure service coverage, identify missing or under-deployed agents, filter gaps by ownership or infrastructure scope, and drill into specific instances that require installation, remediation, or metadata cleanup.
For more details, see Breeze Agent Service Discovery.
Multi-Cloud Spend Dashboard
- Audience: FinOps, cloud platform teams, engineering leaders, finance partners, and infrastructure owners.
- KPIs: Total spend, year-to-date spend, last month spend, month-to-date spend, monthly spend trend, spend by cloud provider, spend by product family/product, and spend by environment.
- Inputs: Cloud billing and usage data, provider cost reports, product and product-family mapping, environment tagging, and reporting calendar dimensions.
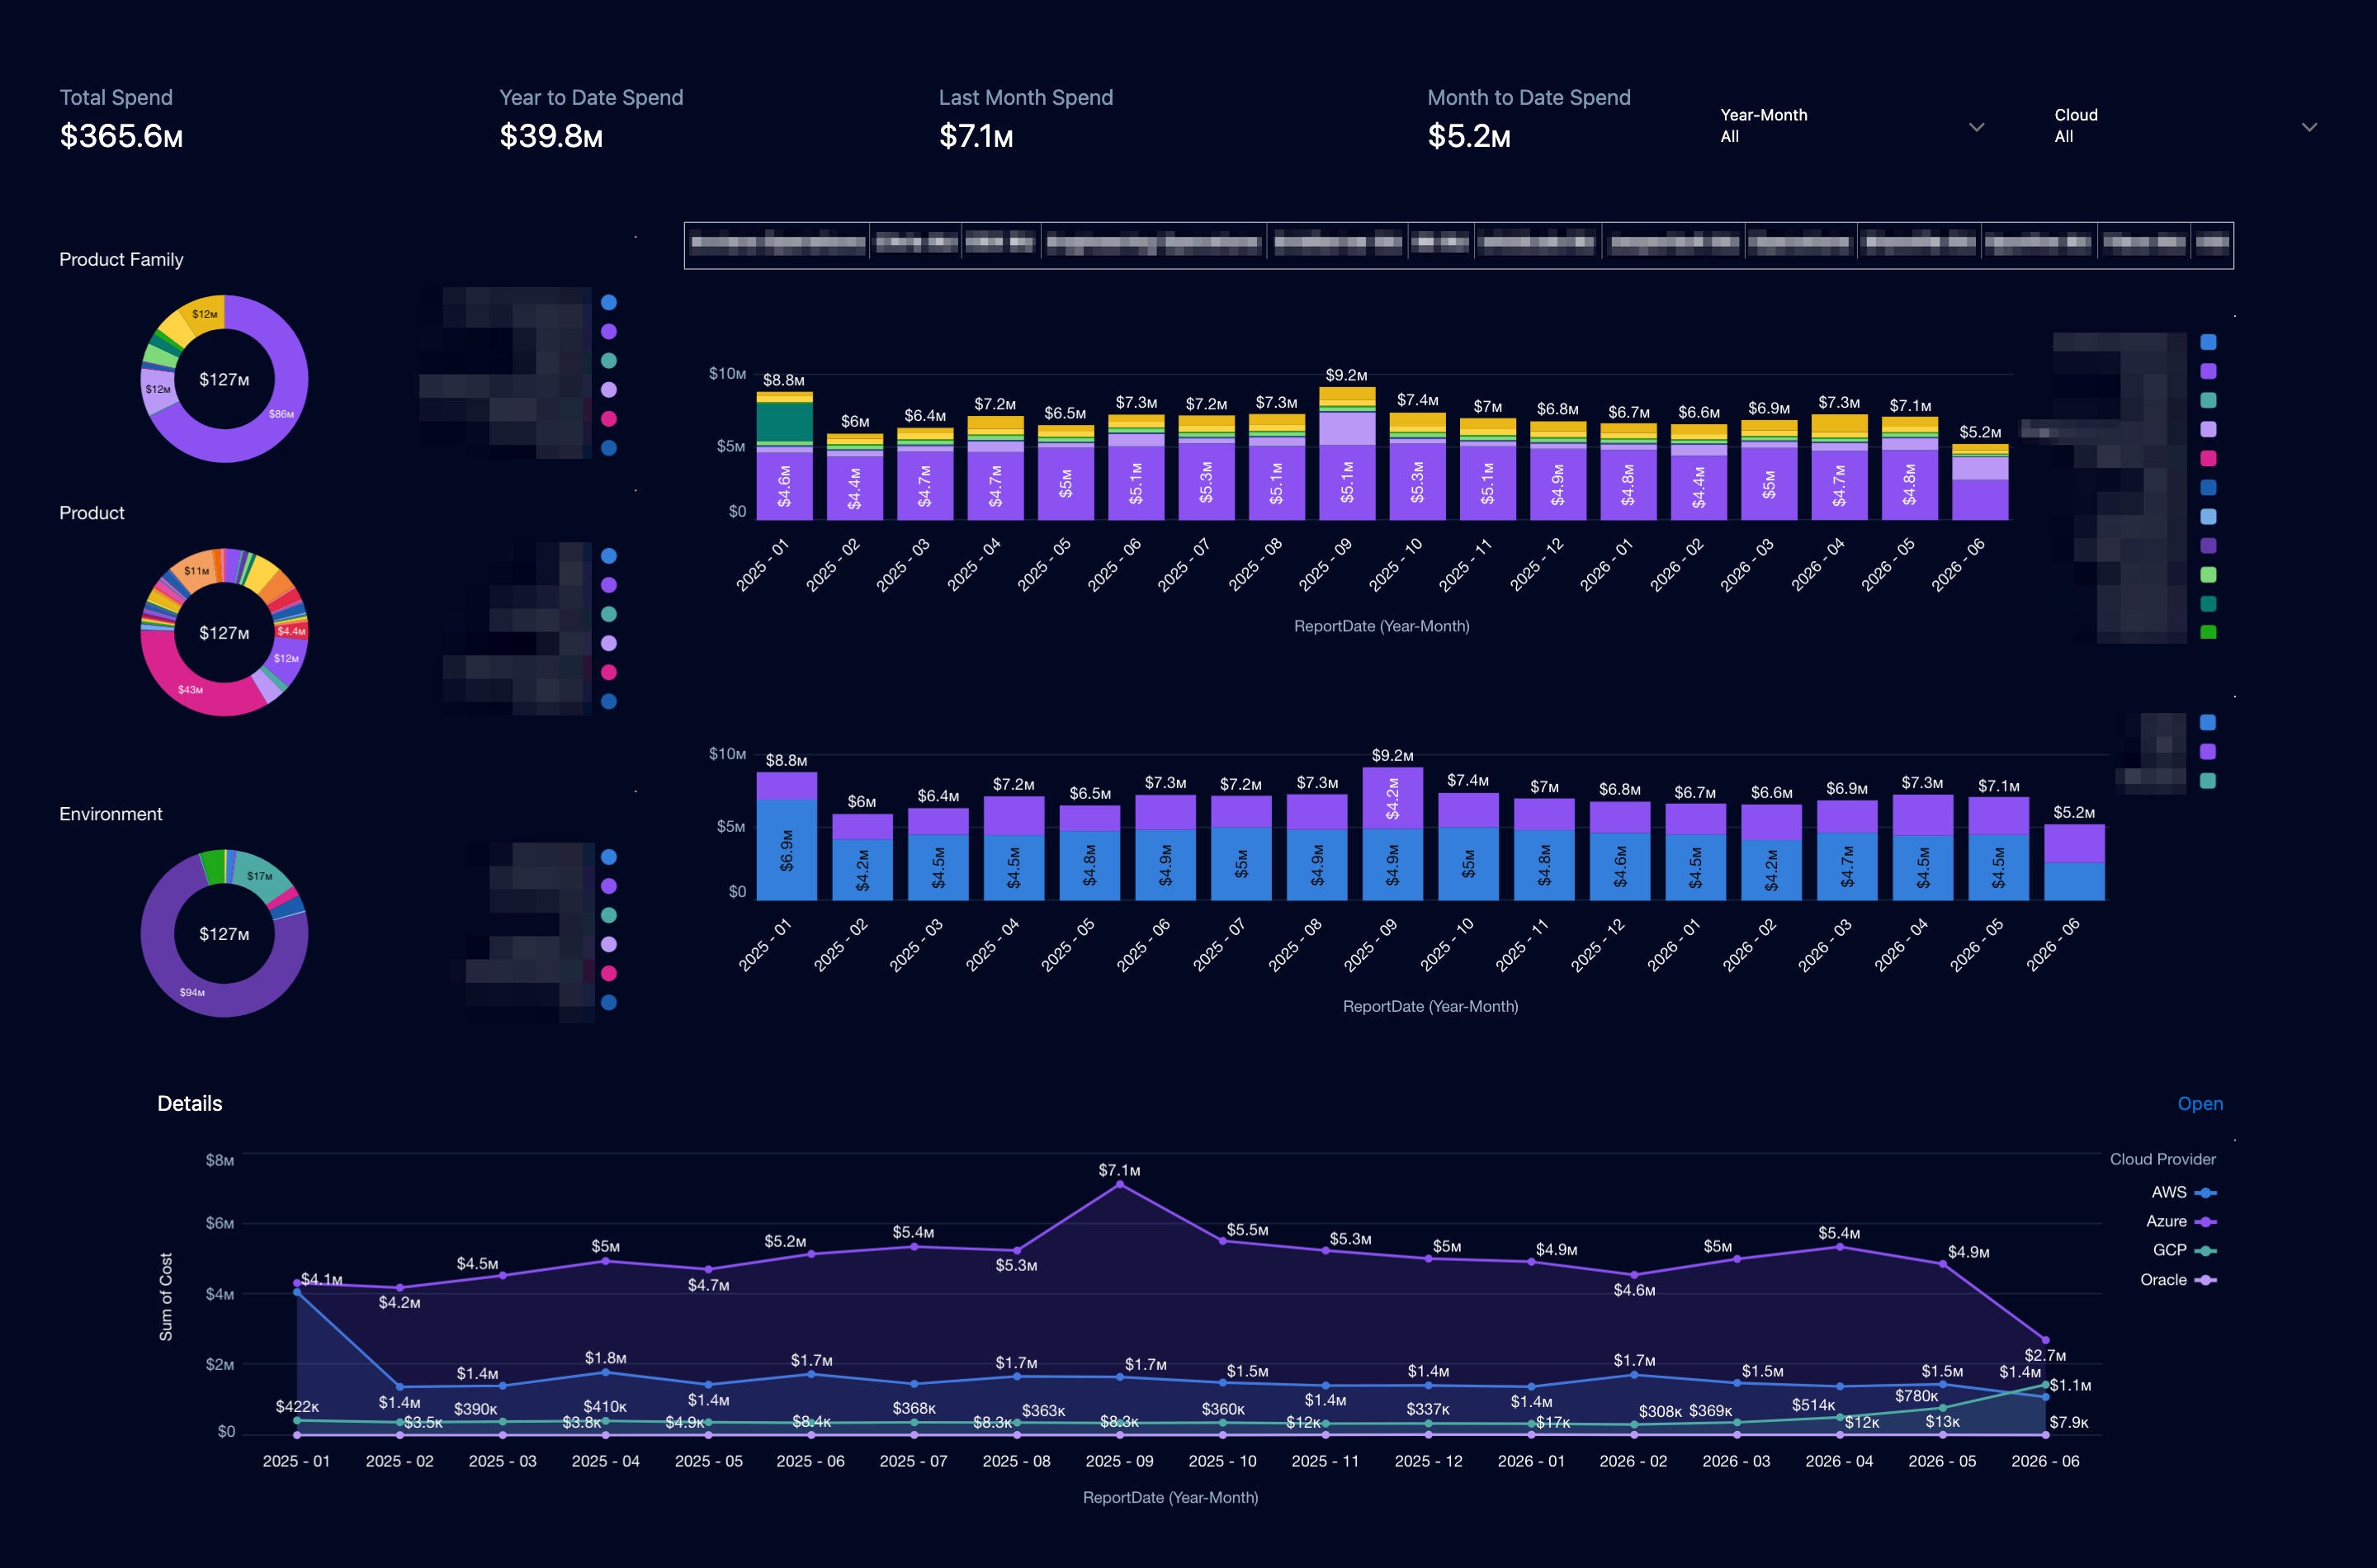
The multi-cloud spend dashboard focuses on overall cloud cost, current-period spend, monthly trends, and spend allocation across cloud providers, products, and environments. It is designed for finance, platform, engineering, and infrastructure stakeholders who want to monitor spend, identify cost drivers, compare provider trends, and drill into areas for optimization and budget control.
For more details, see the Multi-Cloud Spend Dashboard description.
AWS SP Coverage & Utilization
- Audience: FinOps, cloud infrastructure teams, AWS platform owners, and finance stakeholders.
- KPIs: Savings Plan coverage, covered vs. uncovered EC2 usage, Savings Plan utilization %, used vs. unused Savings Plan commitment, on-demand cost, Savings Plan effective cost, and realized savings.
- Inputs: AWS CUR 2.0 data, Savings Plan commitment and ARN details, AWS EC2 usage and instance type data, and business tags such as
Application Type,Environment Typeand other customer-specific tags.
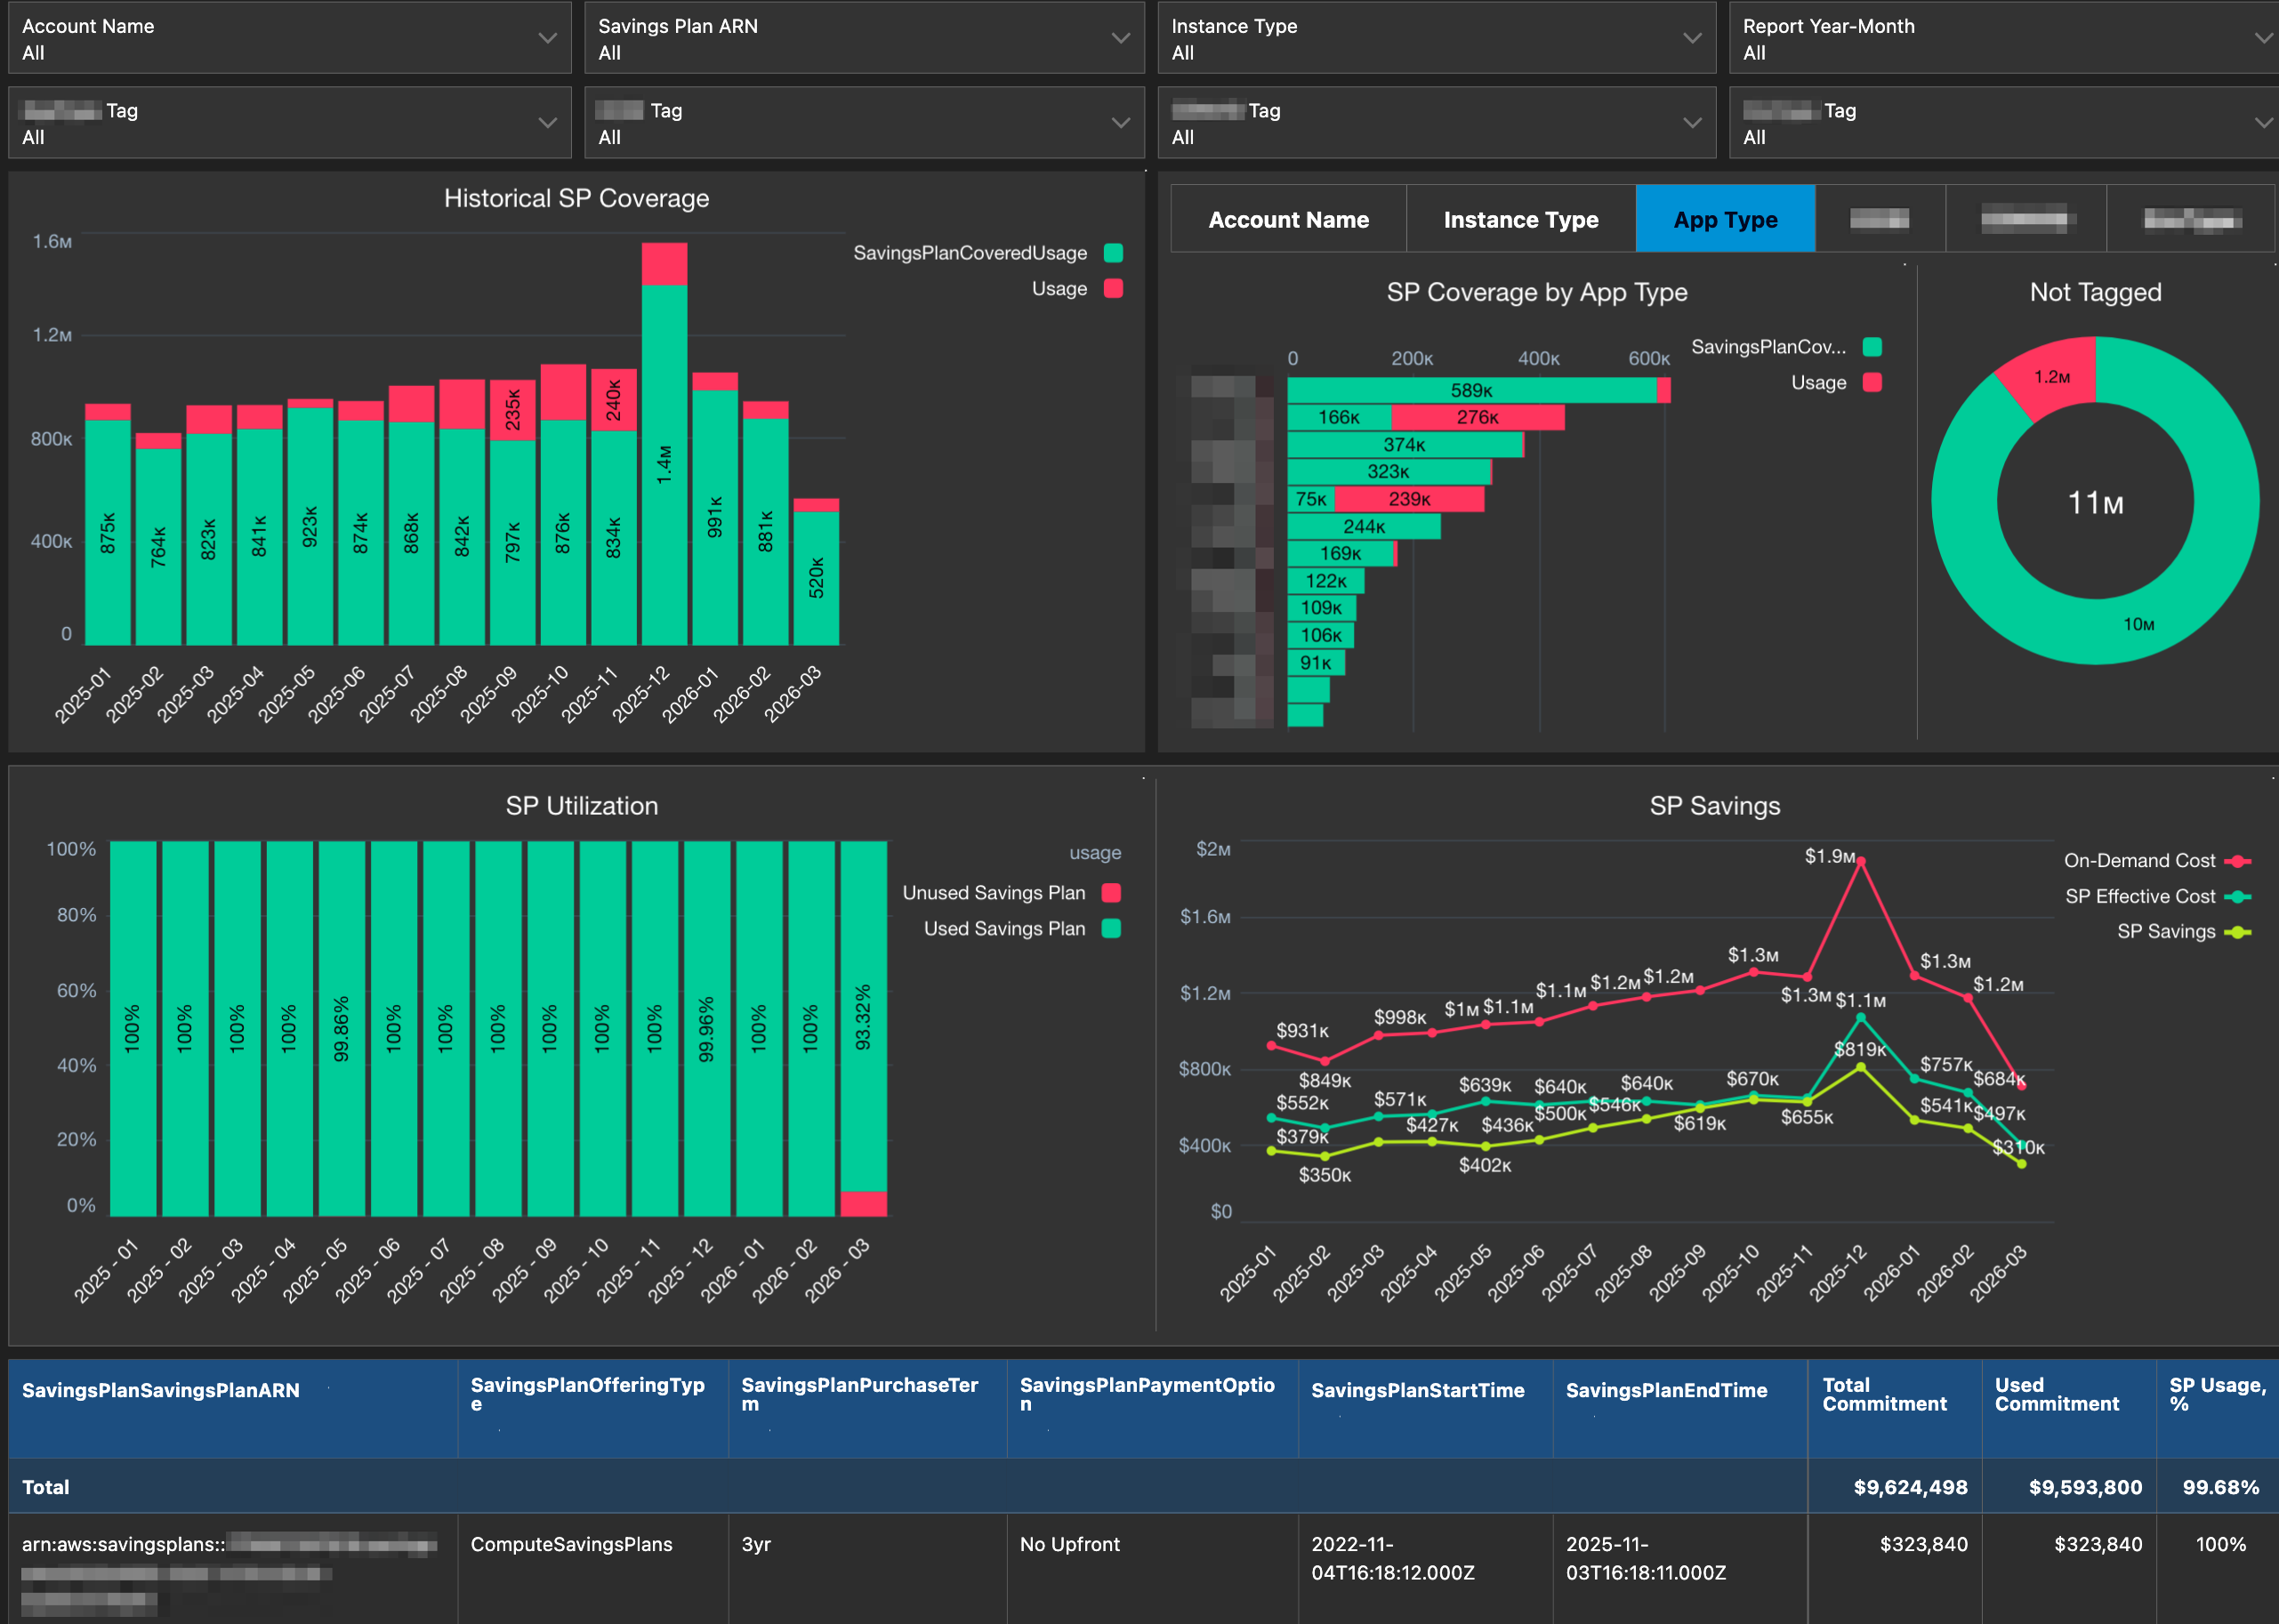
The AWS EC2 Savings Plan dashboard focuses on coverage of eligible EC2 usage, utilization of purchased Savings Plans, and the financial value realized from those commitments over time. It is designed for FinOps, AWS platform, cloud operations, and finance stakeholders who want to monitor commitment efficiency, identify uncovered or underutilized usage, assess savings performance, and drill into accounts, instance types, and tagged business dimensions.
For more details, see the AWS SP Coverage and Utilization Dashboard description.
Azure Cost Anomaly Detection
- Audience: FinOps, cloud operations, platform engineering, service owners, and finance stakeholders.
- KPIs: Daily spend delta %, actual daily spend, forecasted daily spend, daily budget variance, average daily cost over selected days, top subscriptions/products by spend delta %, and top subscriptions/products by spend delta $.
- Inputs: Daily cloud cost and usage data, budget thresholds, forecast logic, subscription and service metadata, product and product-family mapping, ownership mapping, and reporting-type classification.
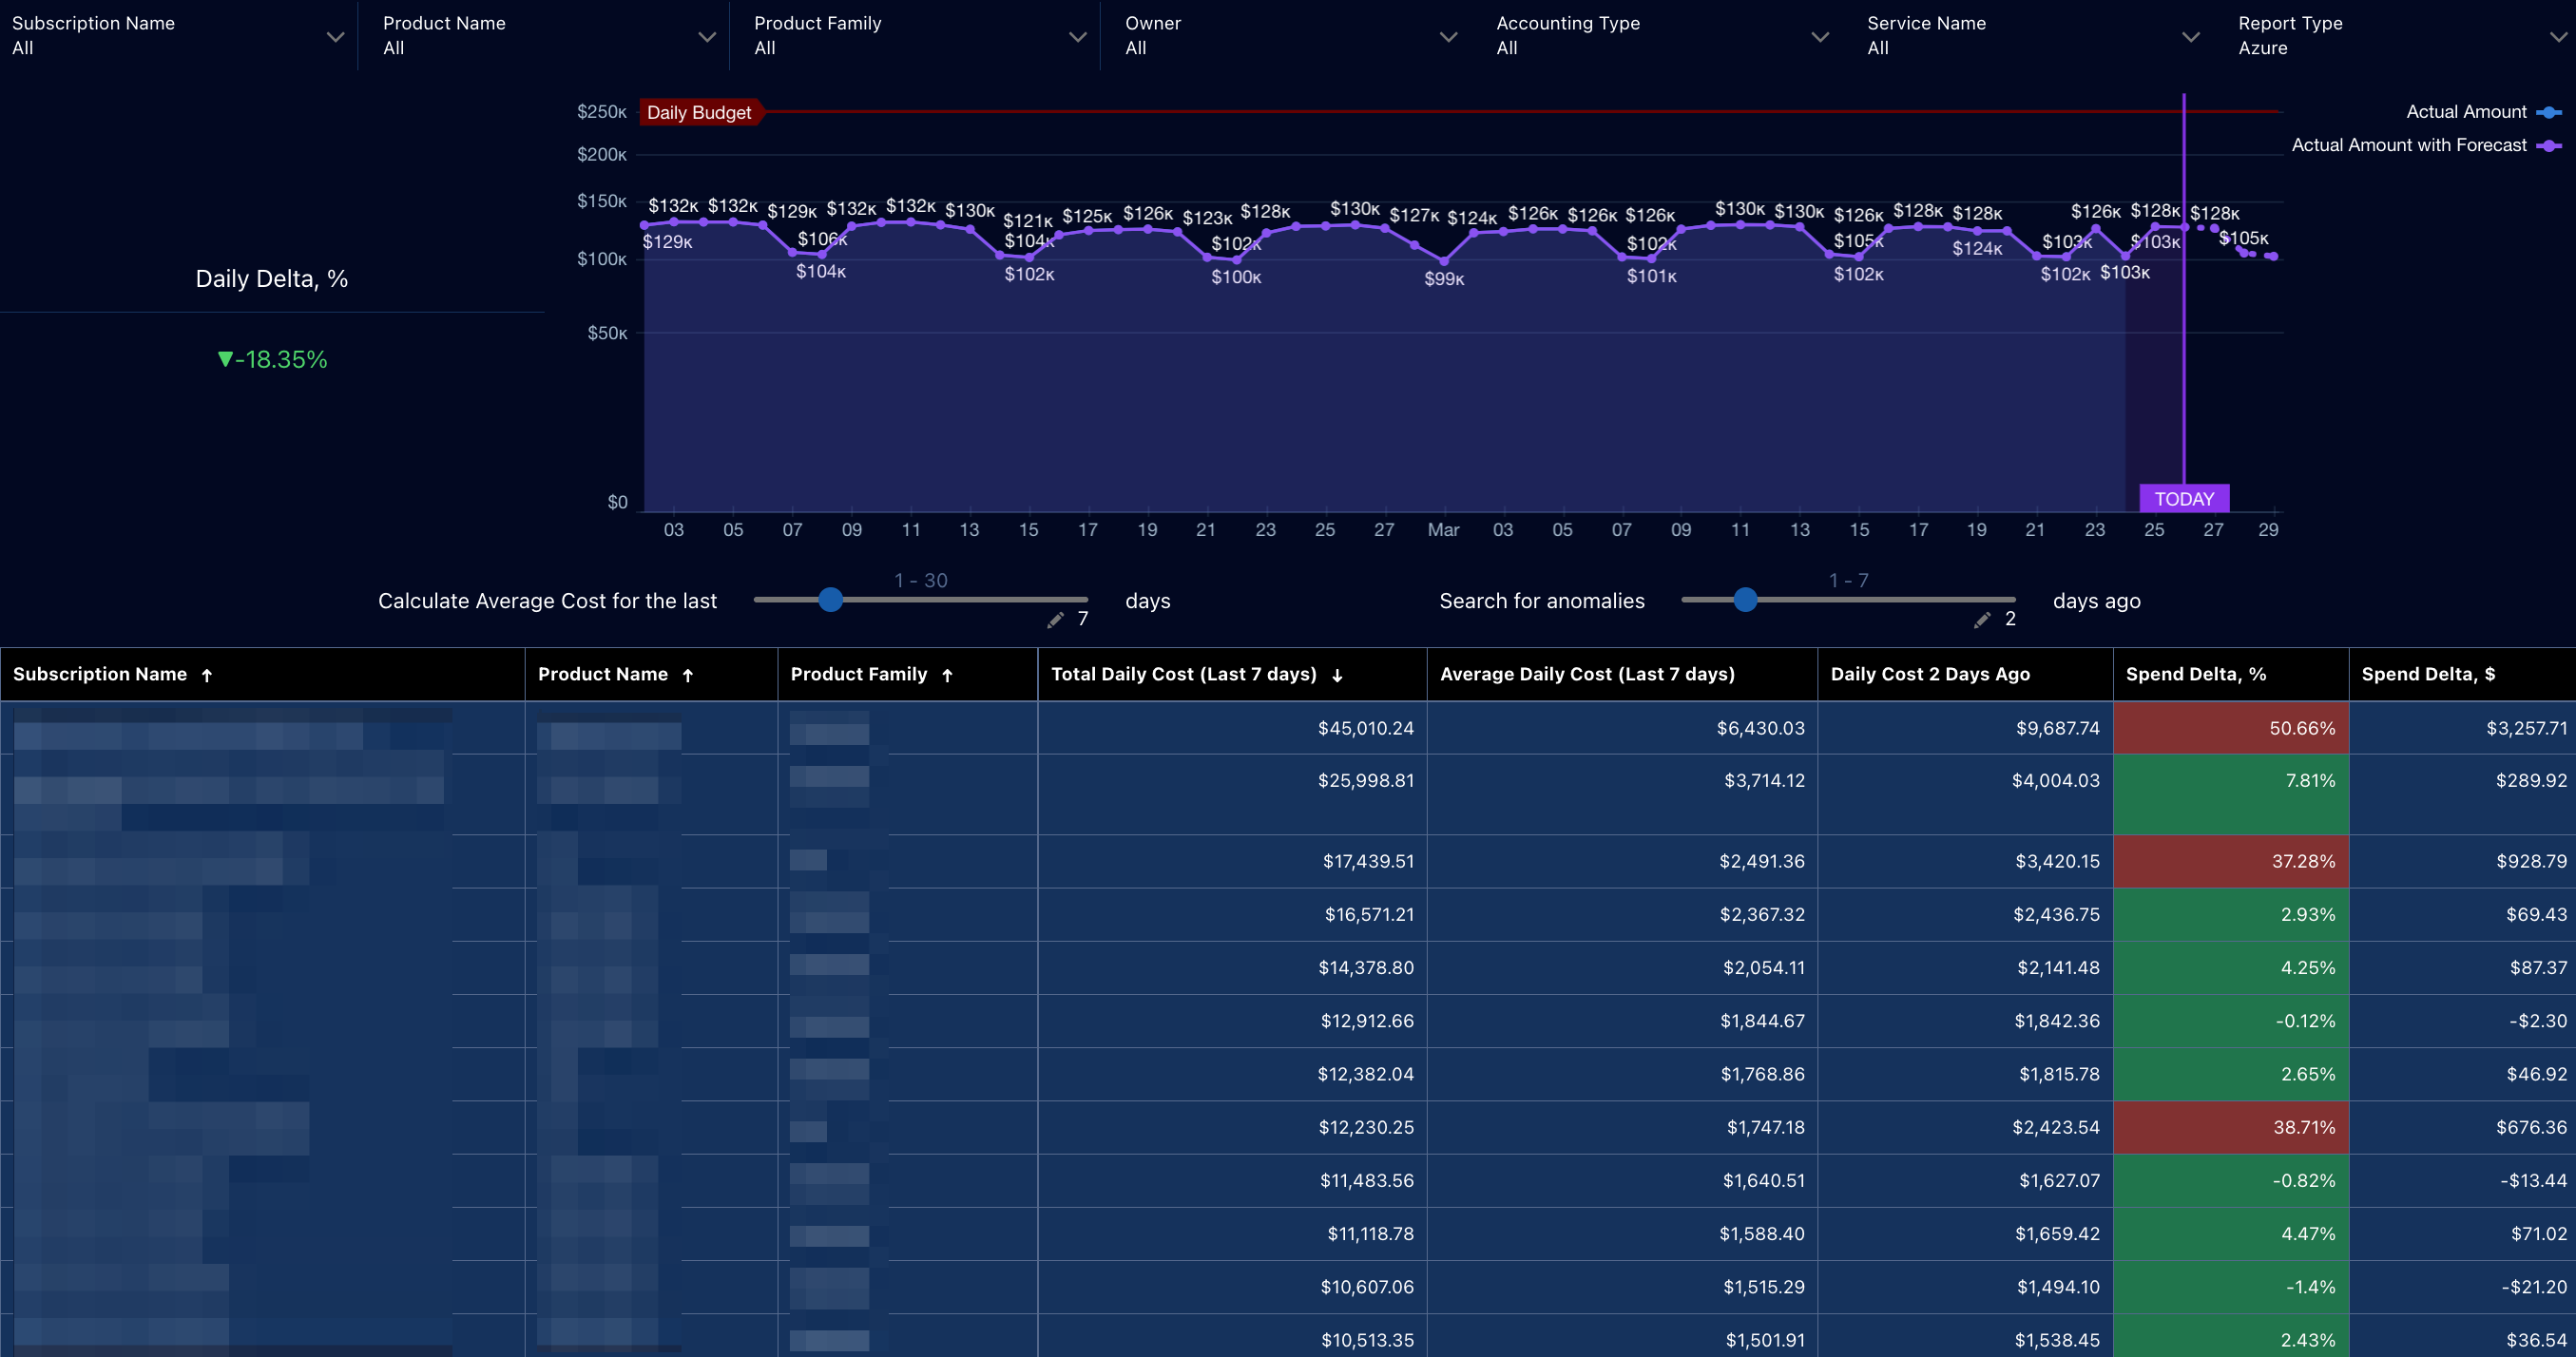
The Azure cost anomaly dashboard focuses on short-term cost movement, budget tracking, forecasted spend, and anomaly detection across subscriptions, products, and services. It is designed for FinOps, cloud operations, platform, and service owners who want to monitor daily spend behavior, compare actuals to budget, detect unusual cost changes early, and drill into the subscriptions or products driving recent variance.
For more details, see the Azure Cost Anomaly Detection Dashboard description.
Azure OpenAI Cost and Token Usage
- Audience: CTOs, FinOps, AI platform teams, engineering leaders, application owners, and finance stakeholders.
- KPIs: Total Azure OpenAI spend, historical monthly and daily cost and usage, spend and usage by token type (input, output, cache), spend and used token amount by subscription, deployment/model, as well as application, environment, team, cost center, or any other applicable billing tag.
- Inputs: Azure Cost Export data for OpenAI cost and token usage metrics, billing tags. Cloudaware CMDB data - for Azure OpenAI Account and Deployment metadata, model or SKU details, subscription metadata, business application mappings, with ownership, business unit, and cost center details.
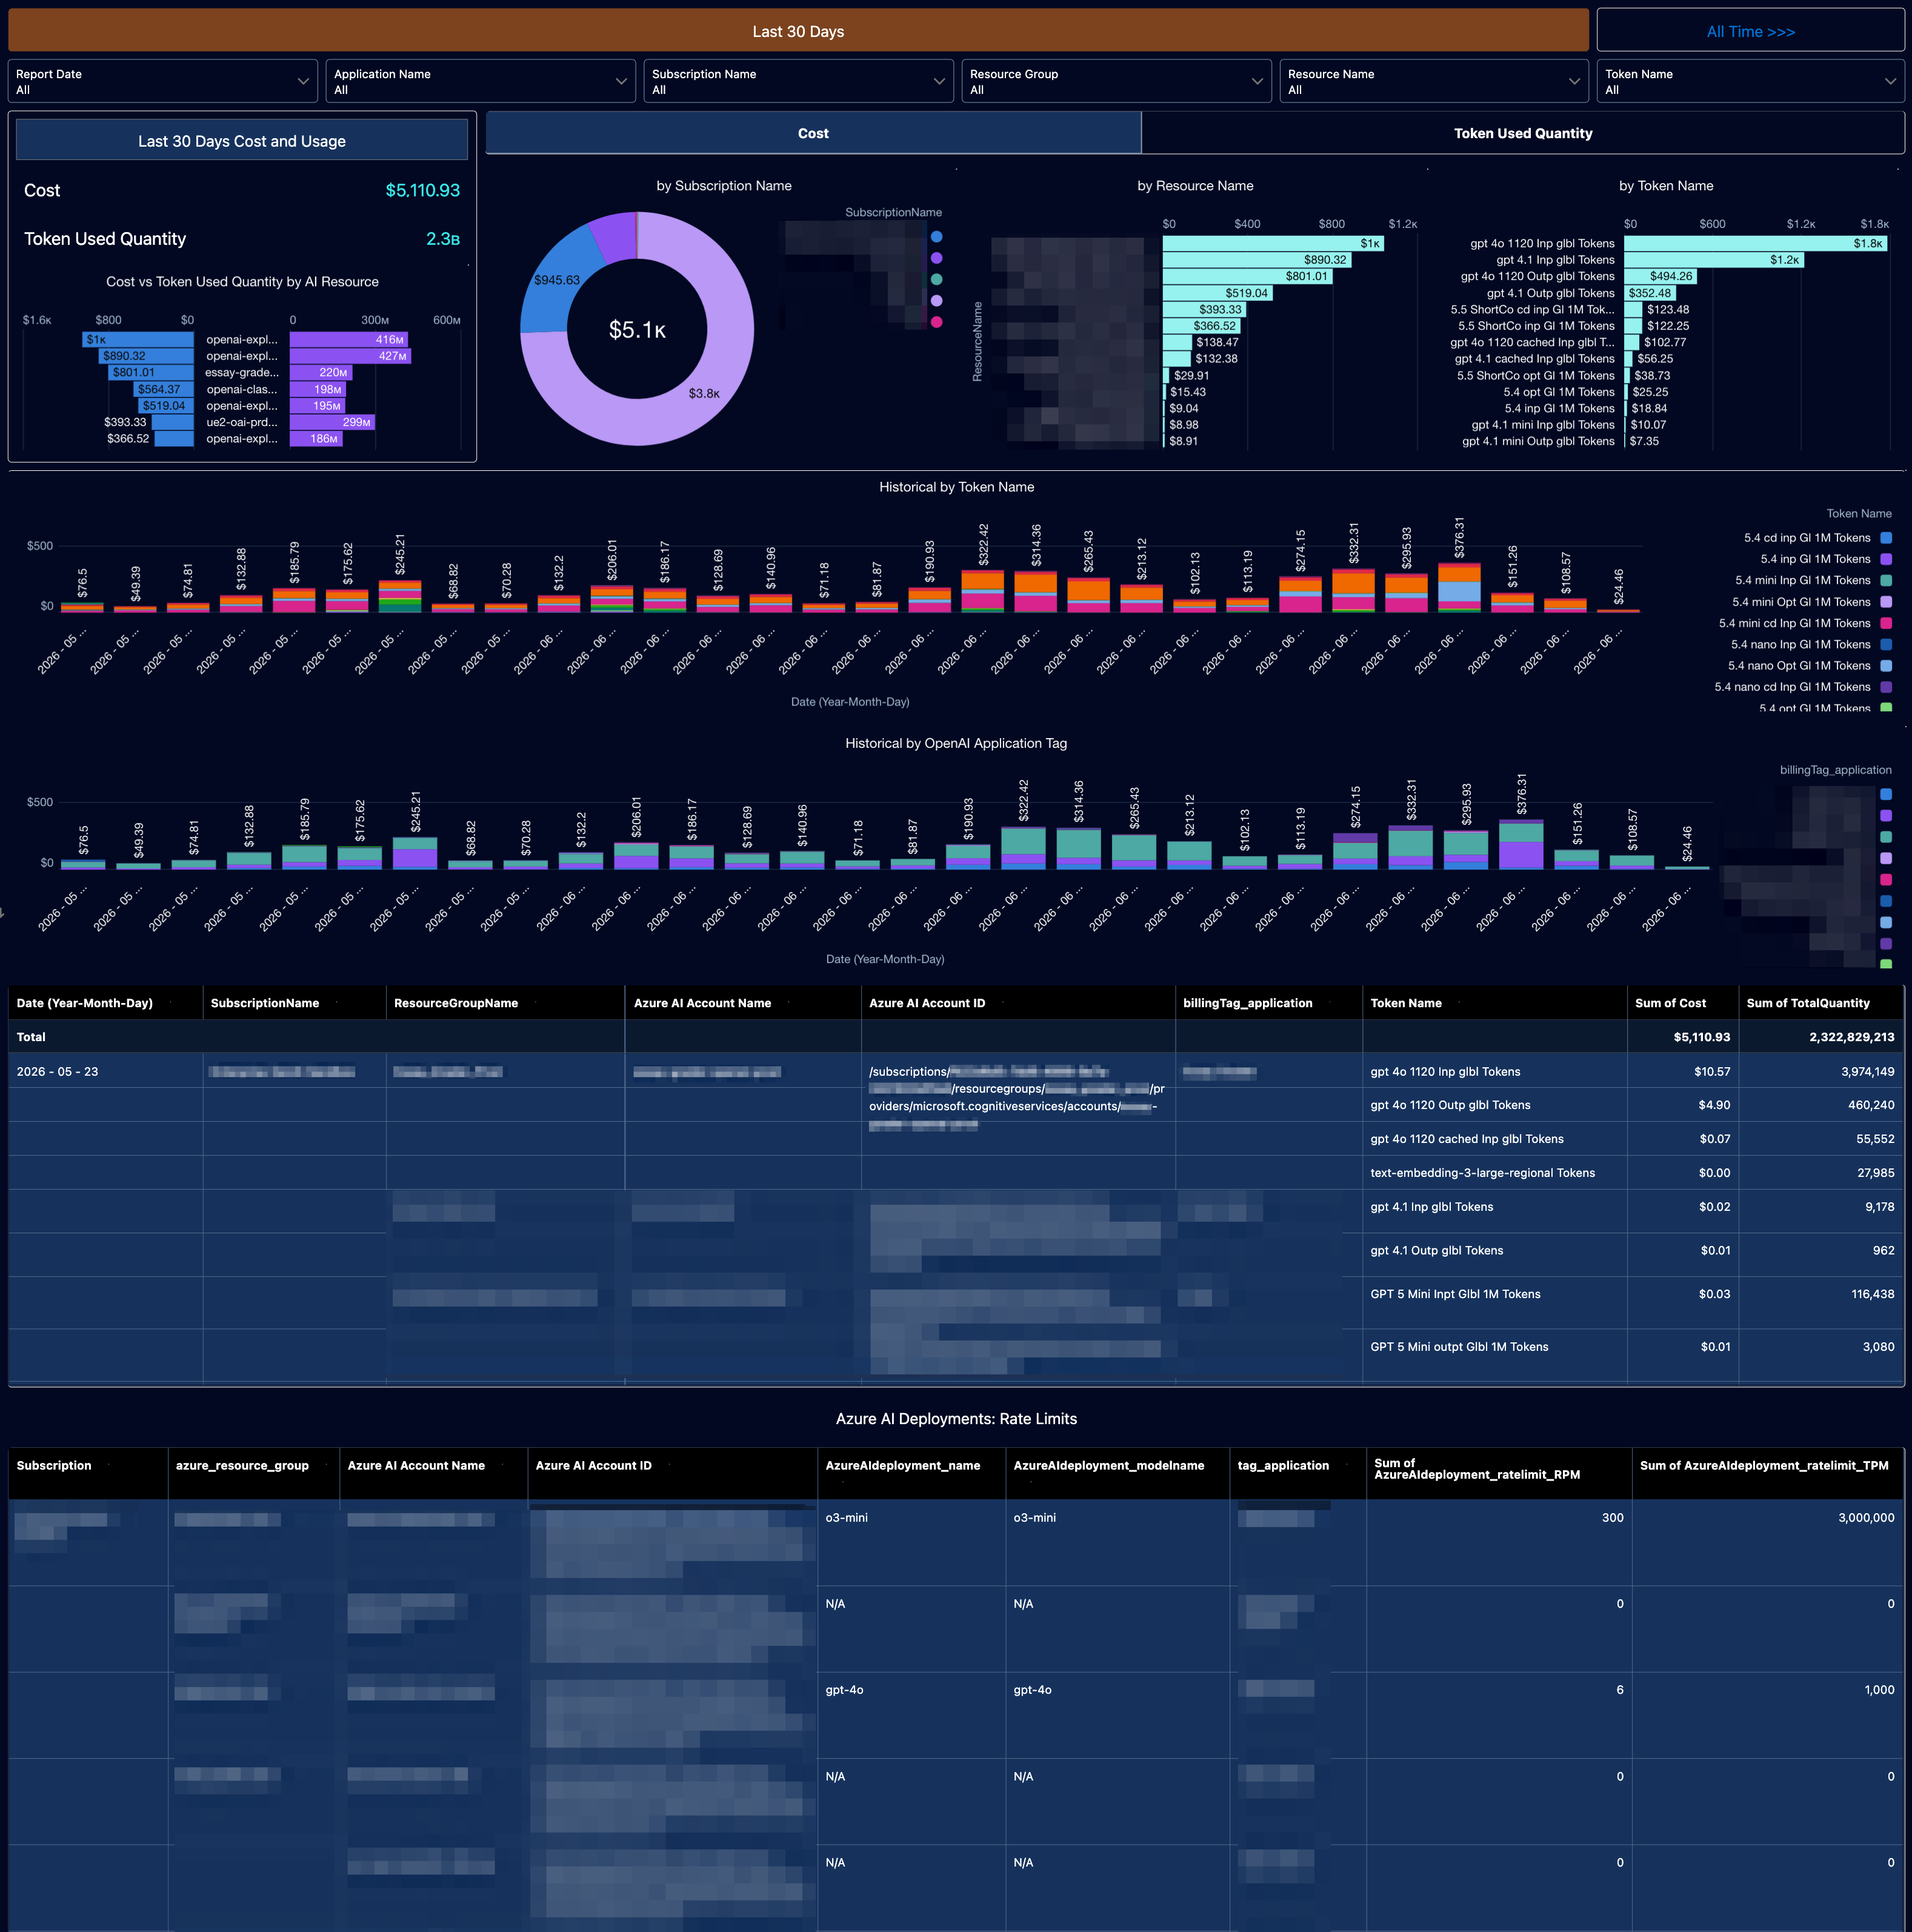
The Azure OpenAI cost and token usage dashboard focuses on financial and consumption visibility for Azure OpenAI workloads. It is designed for FinOps, AI platform, engineering, and finance stakeholders who need to monitor generative AI spend, understand token consumption patterns, compare usage across subscriptions and deployments, identify high-cost applications or teams, and support budget, chargeback, and optimization decisions.
Compliance Overview
- Audience: Cloud governance, security/compliance teams, cloud operations, platform engineering, and audit stakeholders.
- KPIs: Overall compliance score %, compliance score by framework section, MTTR (days), total checks by status, checks by account, checks by object type, and unique resources affected by policy.
- Inputs: Compliance framework and policy definitions, cloud configuration and resource inventory data, policy evaluation results, account and object type metadata, resource status/state messages, and remediation guidance.
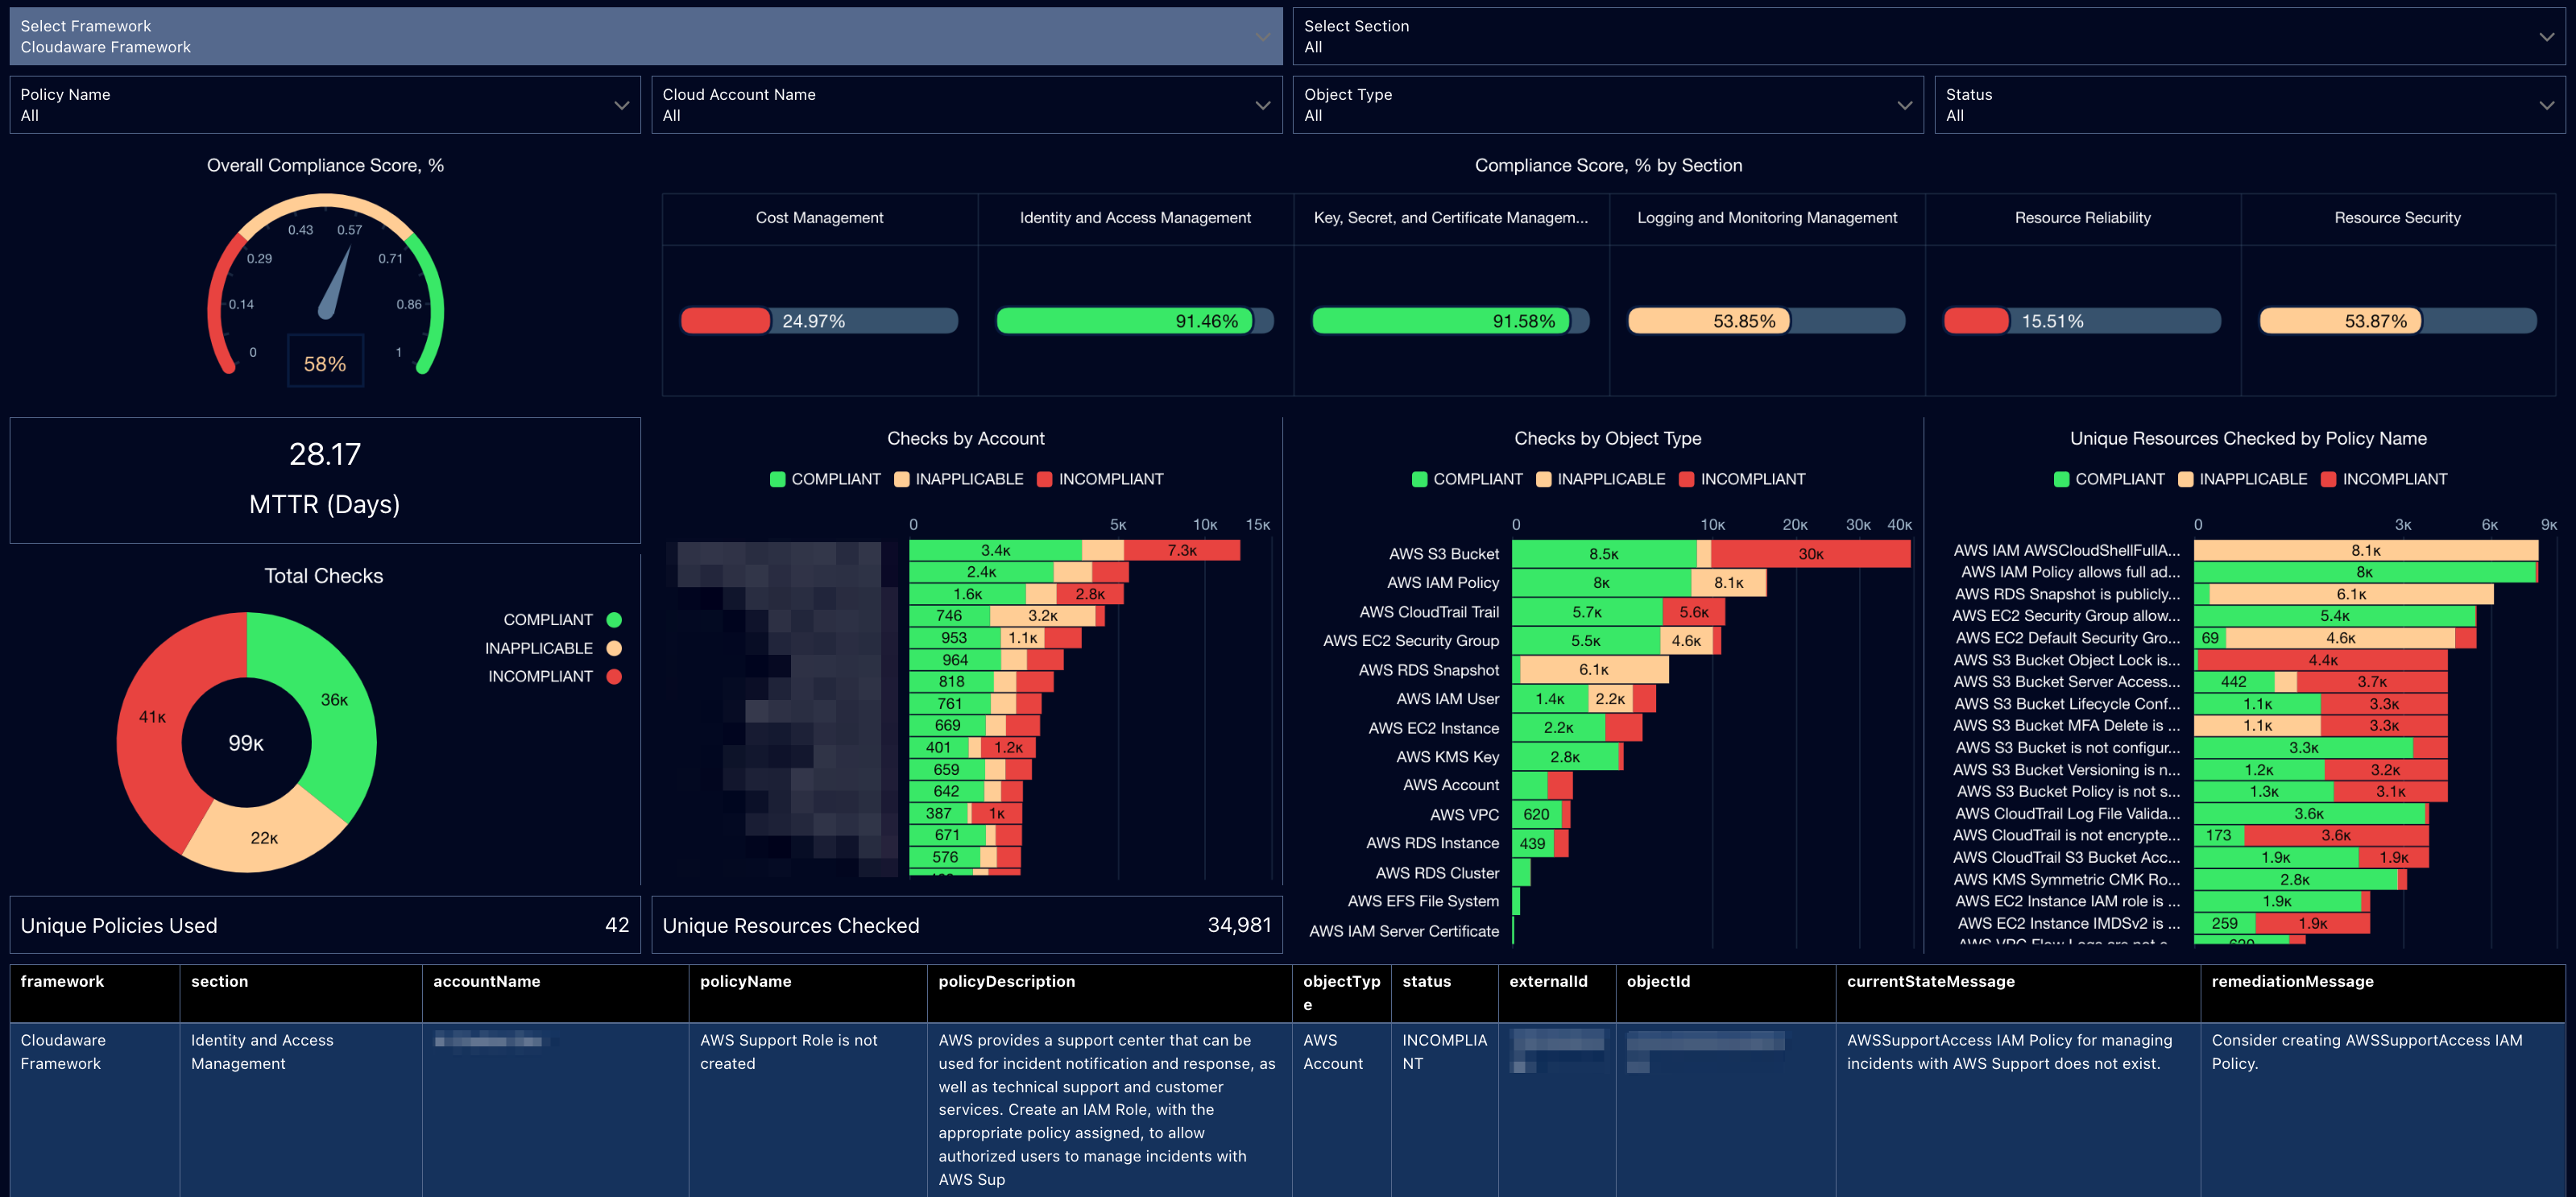
The compliance overview dashboard (legacy) focuses on cloud control adherence, policy evaluation results, remediation performance, and noncompliant resource visibility across accounts and object types. It is designed for governance, security, platform, operations, and audit stakeholders who want to filter compliance results, measure posture against a framework, identify failed controls, and drill into the resources and policies that require remediation.
For more details, see the Compliance Overview Dashboard description.
Tagging Coverage & Compliance
- Audience: Cloud governance, FinOps, platform engineering, security/compliance teams, and resource owners.
- KPIs: Overall tagging compliance %, compliant vs. noncompliant resources, not-applicable rate, compliance by object type, compliance by AWS account, compliance by organizational unit, and required tag coverage by tag category.
- Inputs: Cloud resource inventory, resource tag metadata, required tag policy/rules, AWS account and OU mapping, resource type metadata, creation timestamp, and ownership or service mapping.
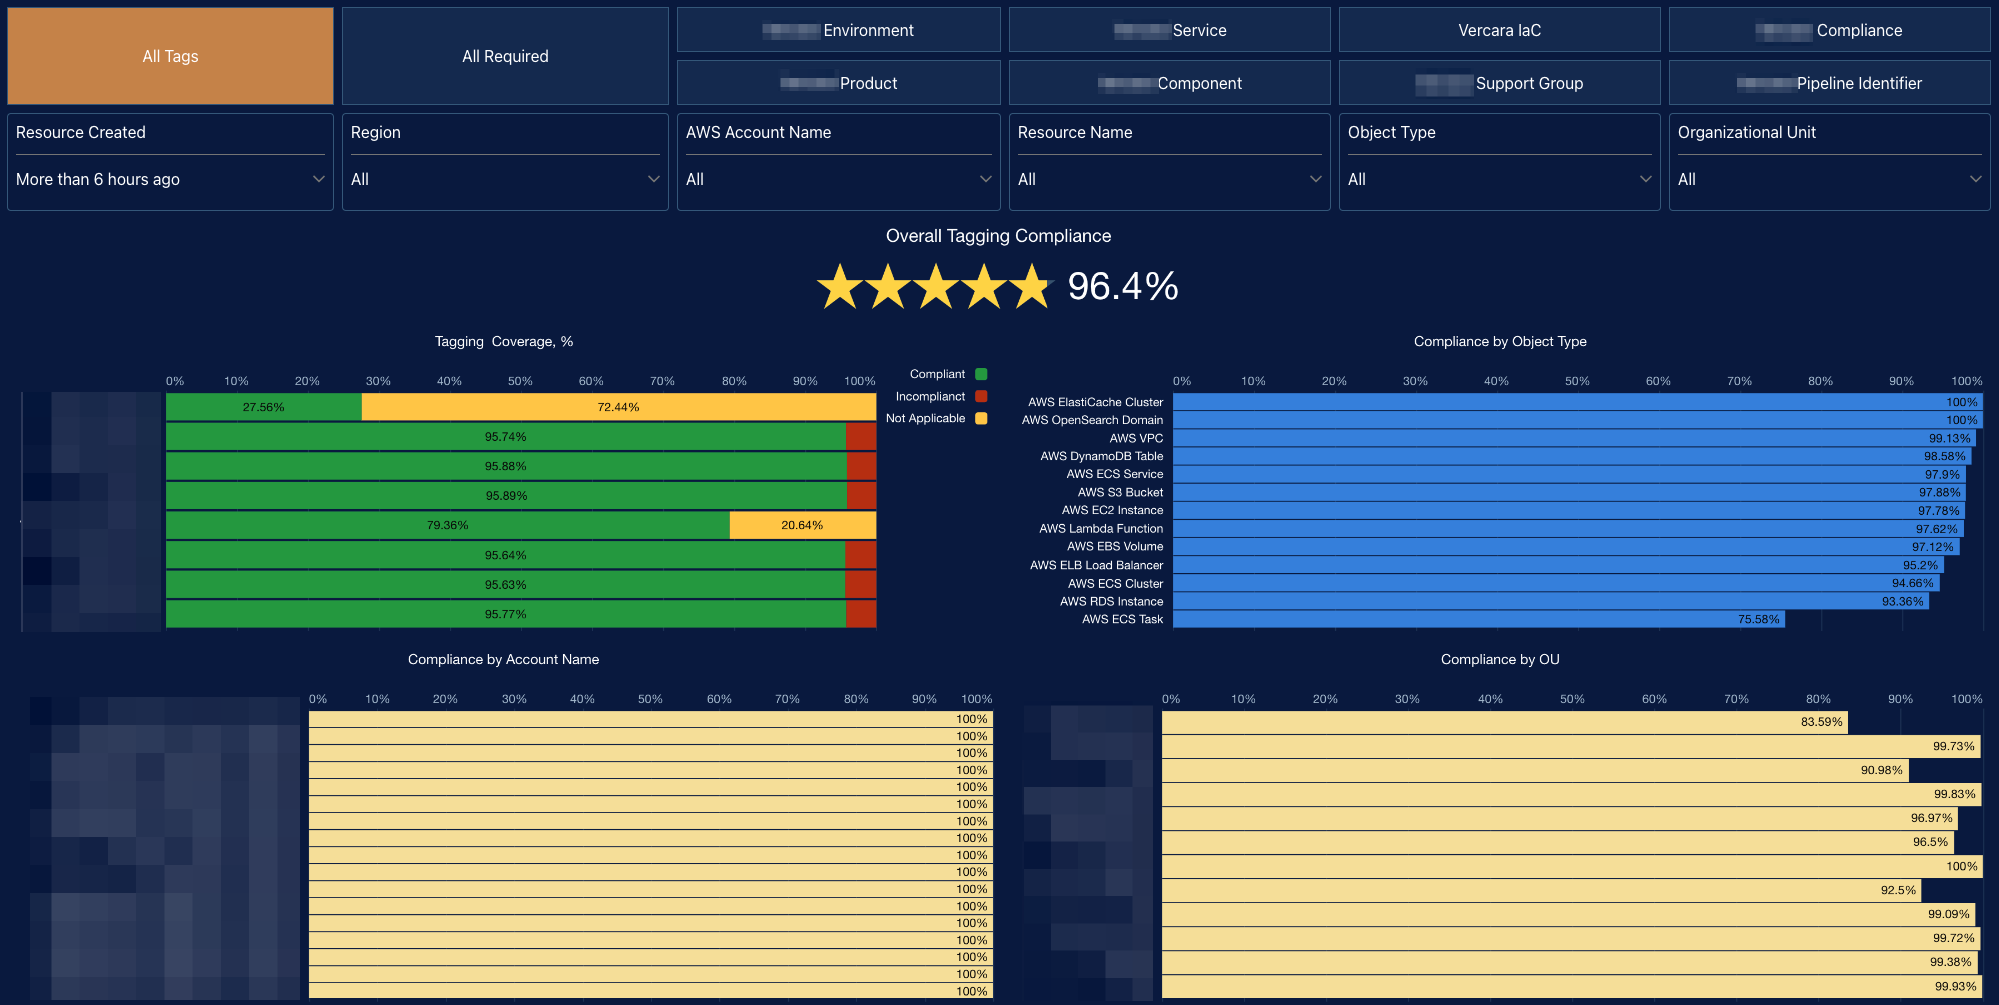
The tagging coverage and compliance dashboard focuses on required tag compliance, missing metadata, and tagging consistency across cloud resources, accounts, object types, and organizational units. It is designed for governance, FinOps, platform, compliance, and operational stakeholders who want to filter the estate, measure tagging adherence, identify gaps in required metadata, and drill into the teams, accounts, or resource types that need remediation.
For more details, see the Tagging Coverage and Compliance Dashboard description.
Vulnerability Scans with SLAs
- Audience: SecOps, IT Ops, infrastructure owners.
- KPIs: Open vulnerabilities by severity, scanned vs. unscanned assets, top risky hosts/images, overdue by SLA.
- Inputs: Vulnerability scan findings, asset inventory, severity/CVE data, ownership and environment mapping.
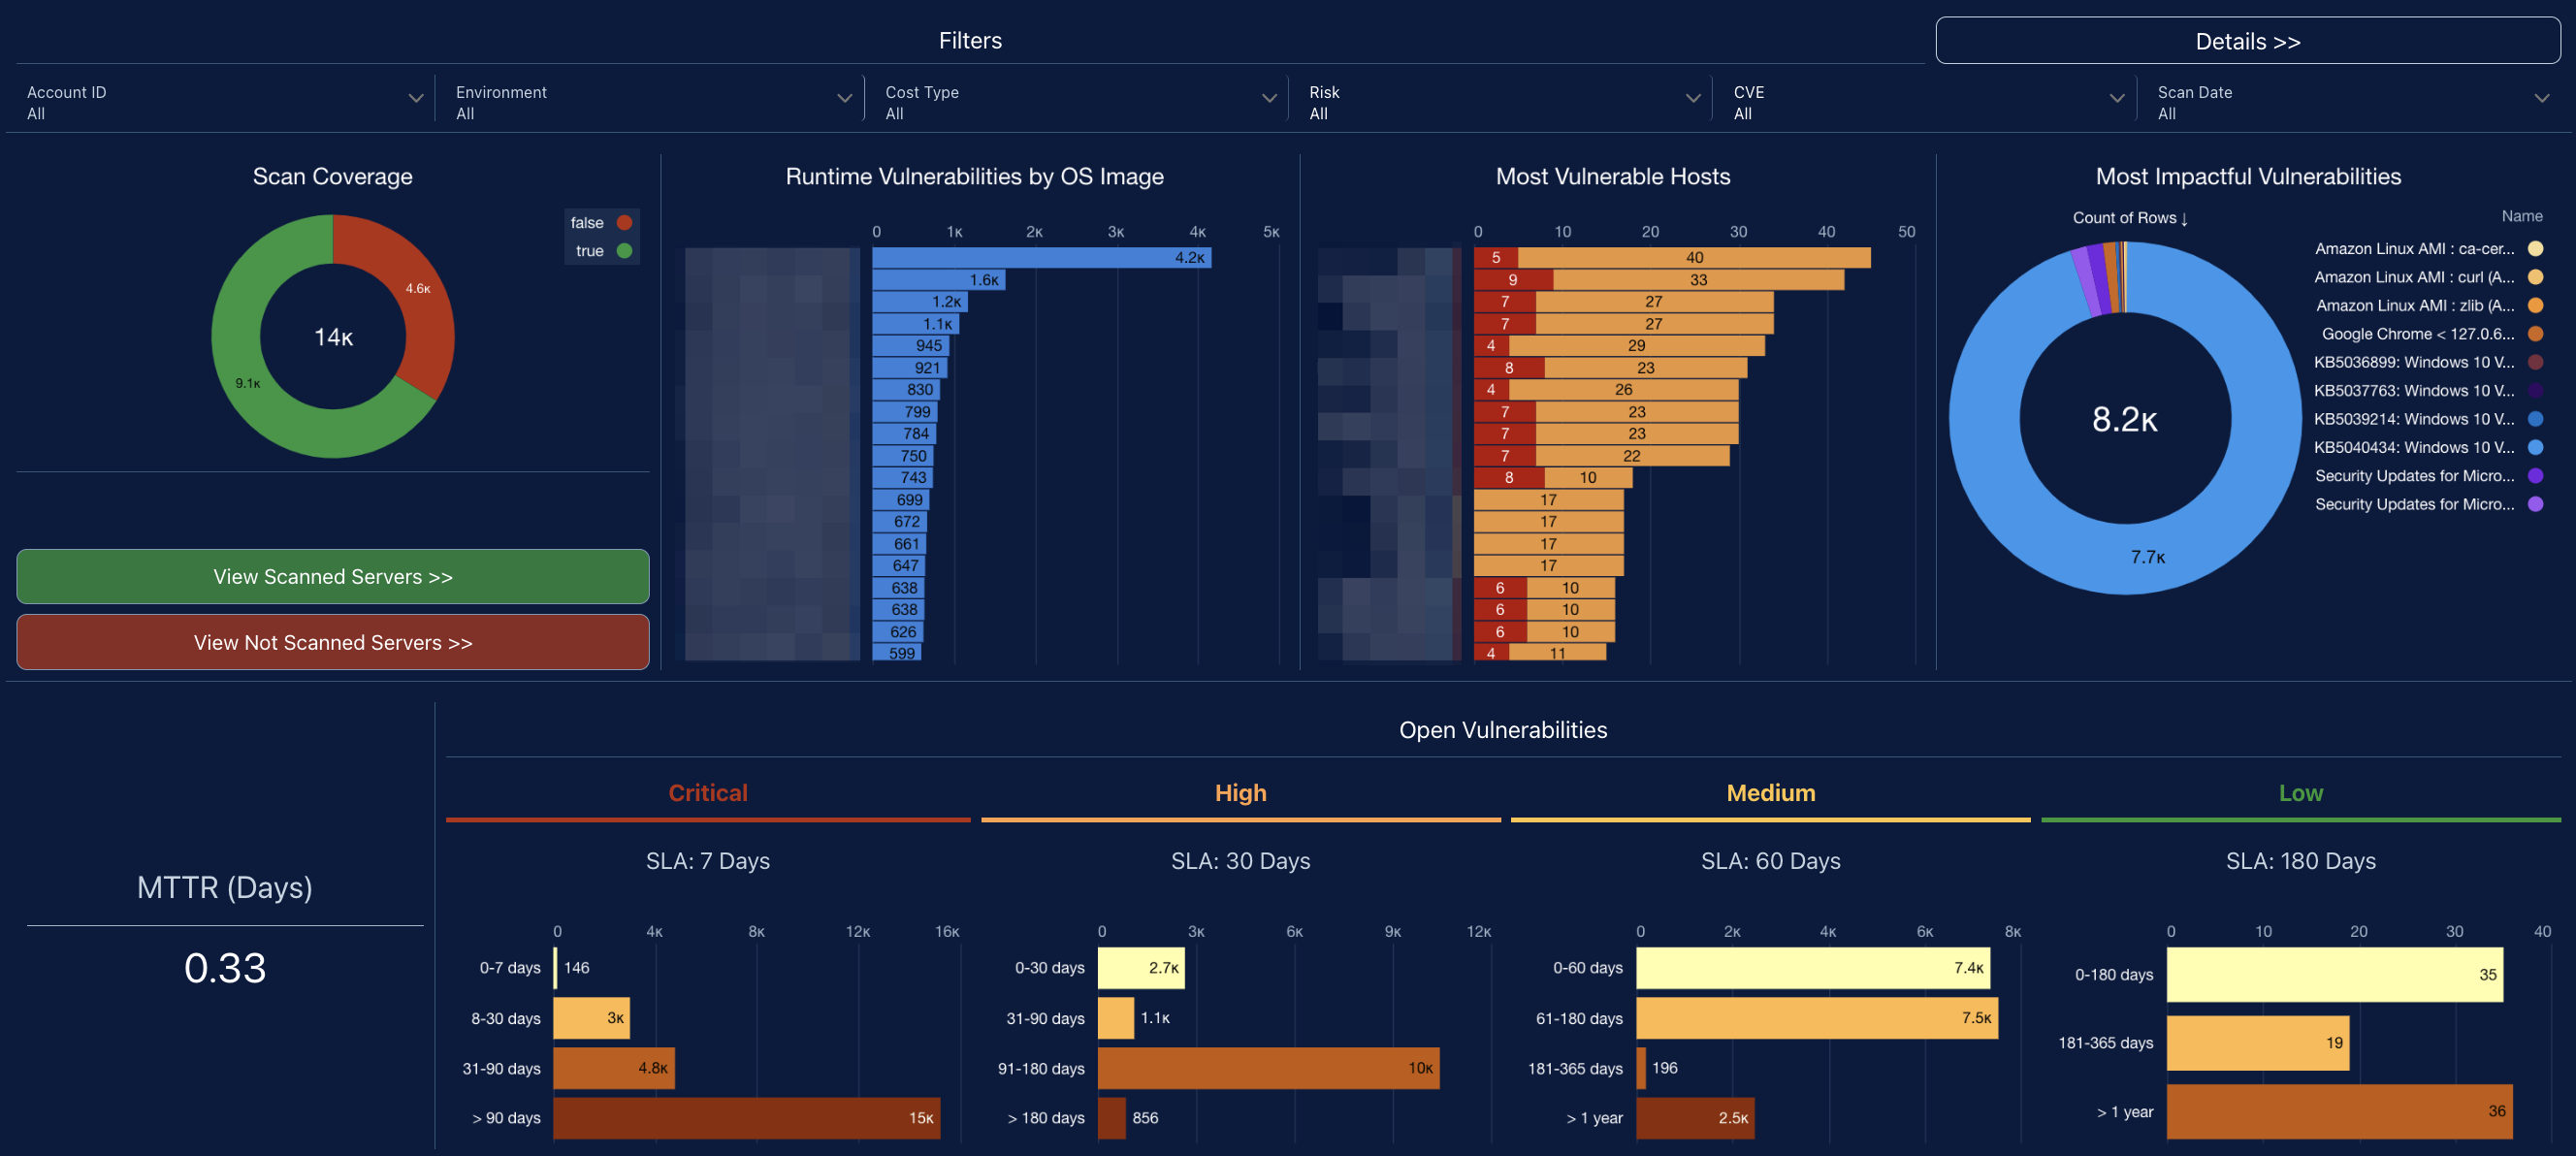
The vulnerability dashboard focuses on open and closed server vulnerabilities, scan coverage, risk severity, aging against SLA, and historical trends. It is designed for security, infrastructure, remediation, and operations stakeholders who want to filter the estate, assess exposure, and drill into remediation priorities.
For more details, see the Vulnerability Scans with SLAs Dashboard description.
Vulnerability Management (Remediation Initiatives & Tasks)
- Audience: SecOps, remediation teams, cloud/platform owners, IT Ops.
- KPIs: Coverage by tasks and initiatives, invalid or unassigned vulnerabilities, MTTR, valid remediation tasks, vulnerabilities closed over time.
- Inputs: Vulnerability findings, remediation task records, remediation initiative mapping, Jira ticket data, cloud account and asset metadata.
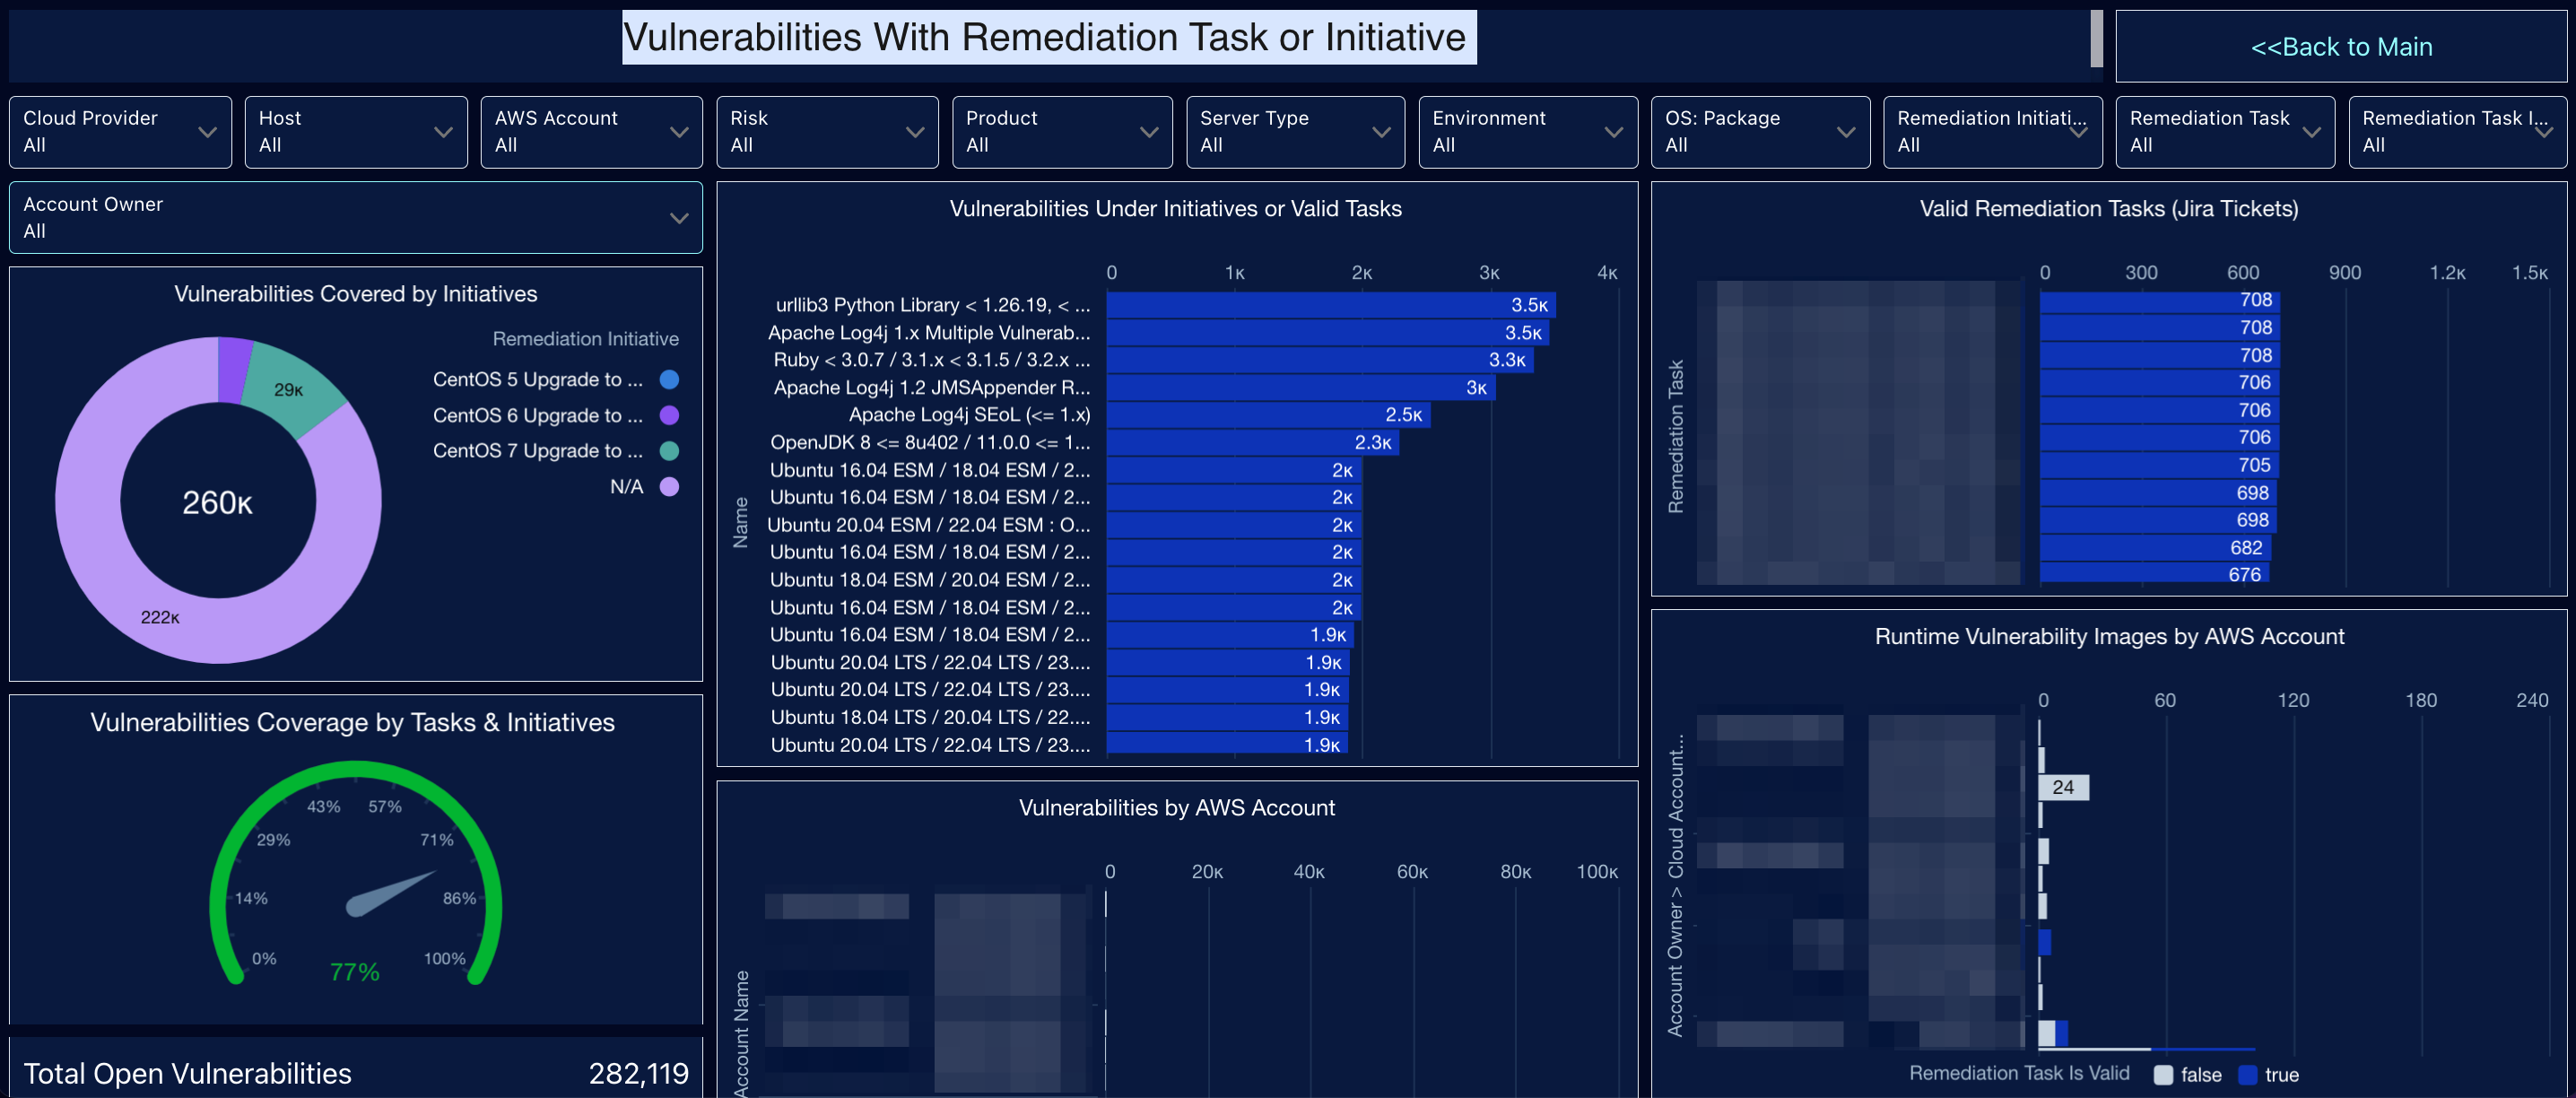
The vulnerability management dashboard on vulnerabilities with remediation tasks or initiatives, including remediation coverage, task validity, initiative alignment, closure trends, and remediation performance over time. It is designed for security, remediation, cloud operations, and governance stakeholders who need to assess whether vulnerability exposure is actively managed, properly assigned, and being reduced through valid execution plans.
For more details, see the Vulnerability Management Remediation Initiatives and Tasks Dashboard description.
Remediation Tasks & Vulnerabilities Exceptions
- Audience: SecOps, vulnerability management, IT Ops, remediation owners, compliance teams.
- KPIs: Open vs. closed remediation tasks, past due tasks, tasks by risk, tasks by Jira status, exceptions count, active vs. expired exceptions.
- Inputs: Vulnerability findings, remediation task records, Jira ticket data, exception records, CVE and risk data, organizational unit mapping.
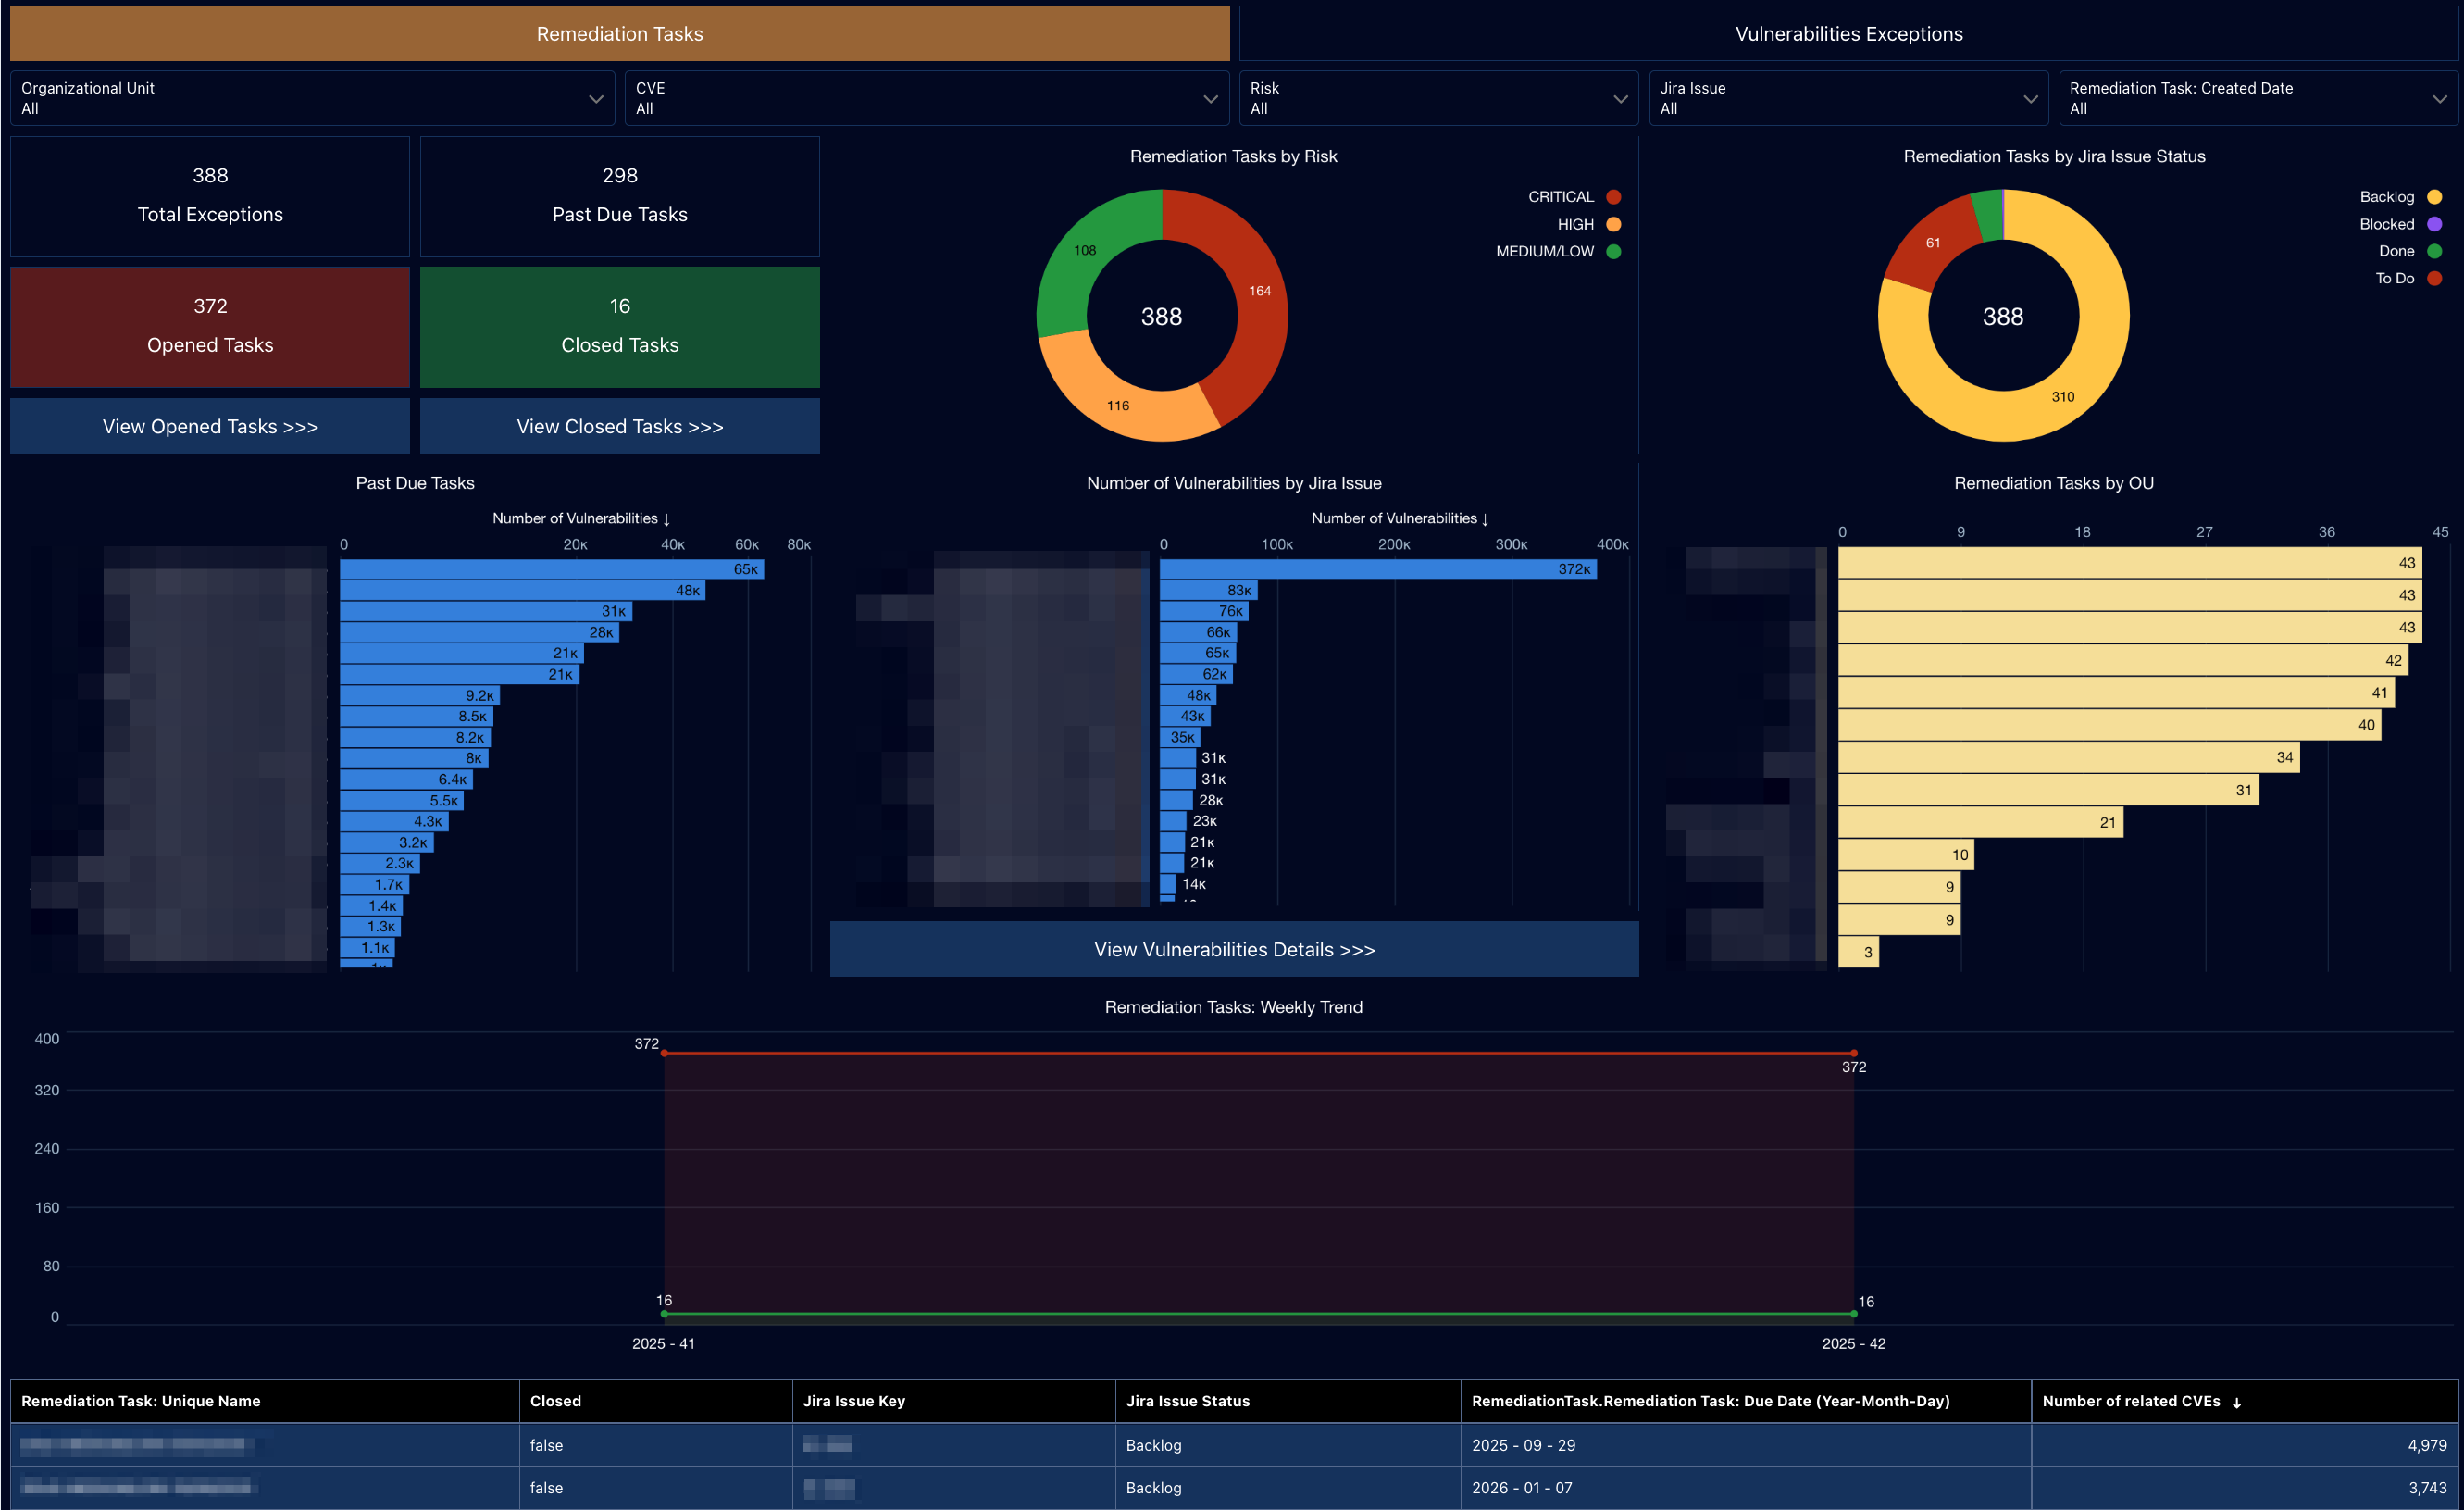
The vulnerability management dashboard focuses on remediation tasks and vulnerability exceptions, including open and closed task volume, overdue work, risk-based prioritization, Jira workflow status, exception counts, and exception aging. It is designed for security, remediation, IT operations, and governance stakeholders who need to track execution, monitor exception use, and assess whether vulnerability exposure is being remediated, delayed, or formally accepted.
For more details, see the Remediation Tasks and Vulnerability Exceptions Dashboard description.
Historical Patching Dashboard
- Audience: Cloud operations, platform/SRE, and patch program owners.
- KPIs: Patch coverage, execution history, exclusions, image age, automation outcomes, and hours saved.
- Inputs: Cloudaware patching data, instance and image inventory, execution logs, exclusion rules, and environment/platform metadata
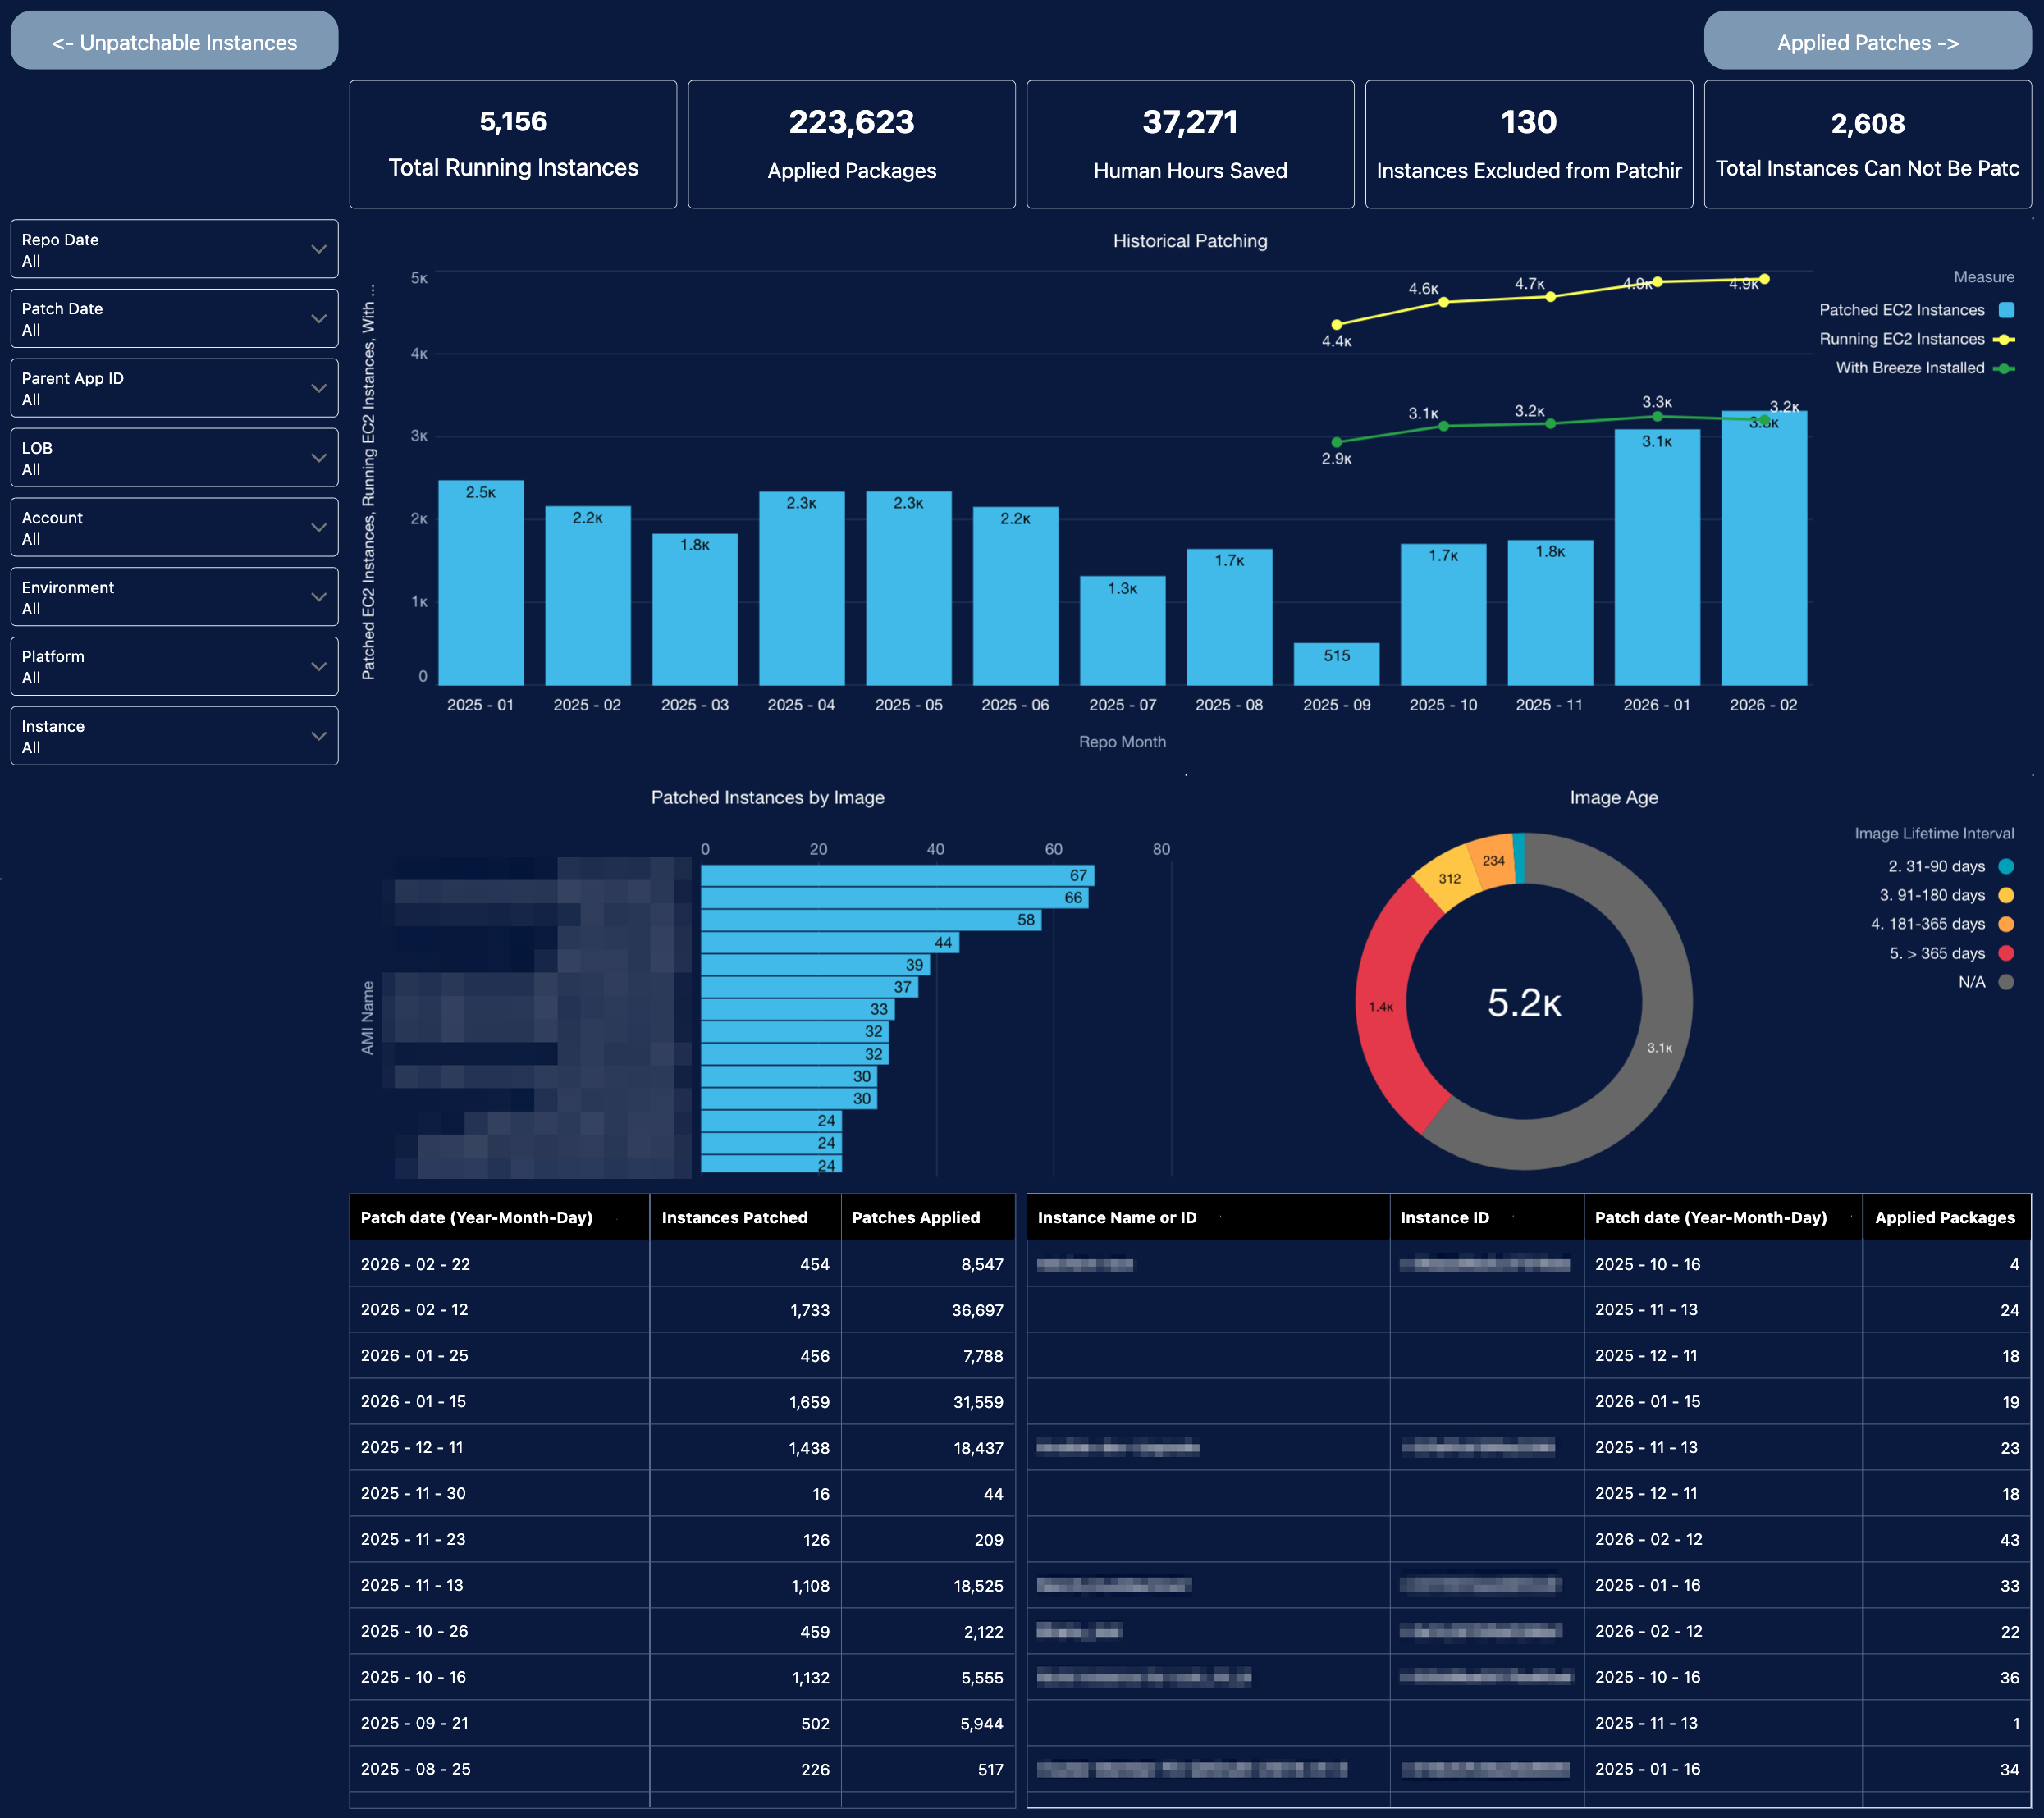
The historical patching dashboard provides centralized visibility into patch coverage, execution history, exclusions, image age, and automation outcomes across the cloud estate, enabling users to monitor program performance, investigate gaps, and measure the value of Cloudaware-managed patch orchestration.
For more details, see the Historical Patching Dashboard description.
New Relic Adoption
- Audience: Observability teams, SREs, platform teams, infrastructure operations, application owners, and engineering leadership.
- KPIs: Installed vs. not installed count and %, account-level adoption, agent version distribution, day-over-day trend, month-over-month trend, and detailed server-level status.
- Inputs: Asset inventory, business context (Account, Application ID, LOB), and New Relic agent data (install status, platform, version, timestamp).
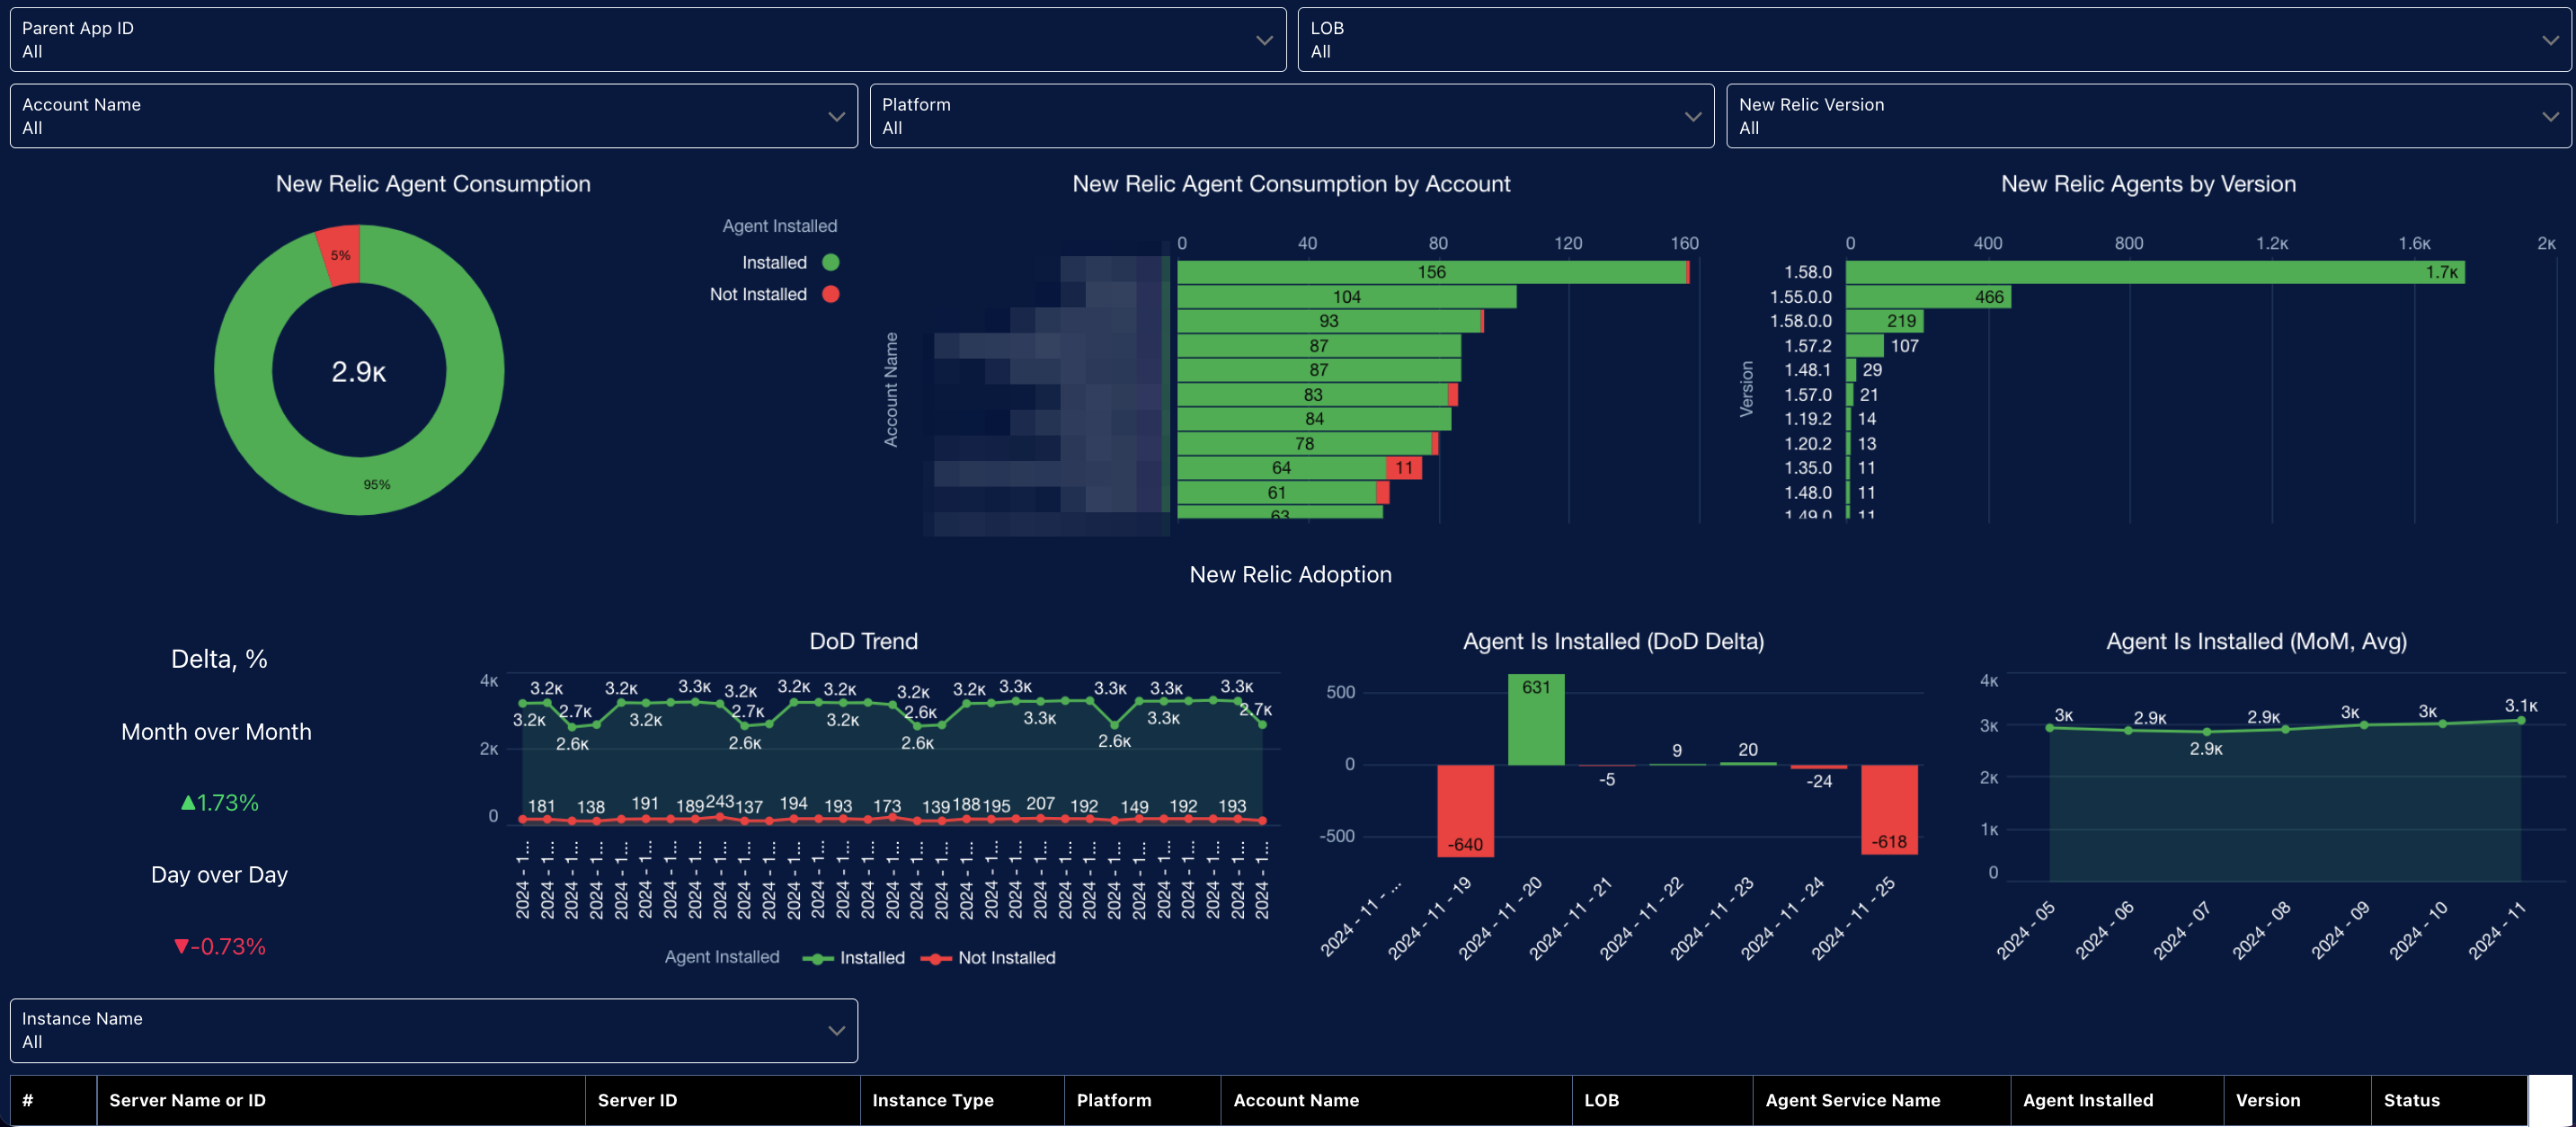
The New Relic agent adoption and coverage dashboard is designed to give leaders, platform teams, and application owners a fast view of how broadly New Relic monitoring is deployed, where gaps exist, and whether adoption is improving over time.
For more details, see the New Relic Agent Adoption and Coverage Dashboard description.
Export Formats & Scheduling
Reports
Export formats and options:
- Formatted Report (
.xlsx): Retains the report’s layout, including headers, groupings, and subtotals. This is best for sharing formatted data. - Details Only (
.csvor.xls): Provides raw data, omitting groupings and totals, which is generally better for importing into other systems or Excel power queries. - Encoding Options: Users can select encoding (e.g., Unicode, Western European) when exporting in Salesforce Classic UI.
See also:
Dashboards
- Share dashboards via app access or direct URL
- Download dashboard images or PDF files
- Schedule email subscriptions for dashboard widget update
- Schedule widget- or lens-level filtered data exports to
.csv/.xlswhere enabled
Export formats and options:
-
.csv(Operational Exports)- Use REST+SOQL queries to shape fields for downstream systems; schedule with CLI (see Supported Queries)
- Include stable IDs, ownership, timestamps for reconciliation
-
.pdf/Images (Snapshots)- Share executive snapshots on a cadence (monthly/quarterly)
- Capture quarter‑over‑quarter comparisons where helpful
-
BI/Warehouse Feeds
- Push datasets to S3/Blob/BigQuery/Snowflake for cross‑domain analytics (see Advanced Analytics Integrations).