Coverage Reporting
Use this guide to learn how Patch Management coverage is measured and how coverage dashboards help monitor adoption, identify blind spots, and track patching performance over time.
Dimensions of Coverage
Typical metrics include:
- Percentage of hosts tracked in the CMDB with Breeze Agent installed and reporting.
- Percentage of eligible hosts included in at least one baseline or patch job.
- Hosts with stale patch data (for example, not checked in recently).
- Hosts that are tracked in CMDB but explicitly excluded from Patch Management.
Dashboards
Improving coverage is often the fastest way to reduce blind spots in your vulnerability and compliance posture.
Use Cloudaware analytics dashboards to:
- Track coverage trends over time.
- Identify teams or applications with low coverage based on SLAs.
- Prioritize patching for specific accounts or environments.
Historical Patching Dashboard
The dashboard shows the operational performance and coverage of the patching program over time. It gives users both an executive summary and a drill-down view into what was patched, when it was patched, and where risk or exceptions still exist.
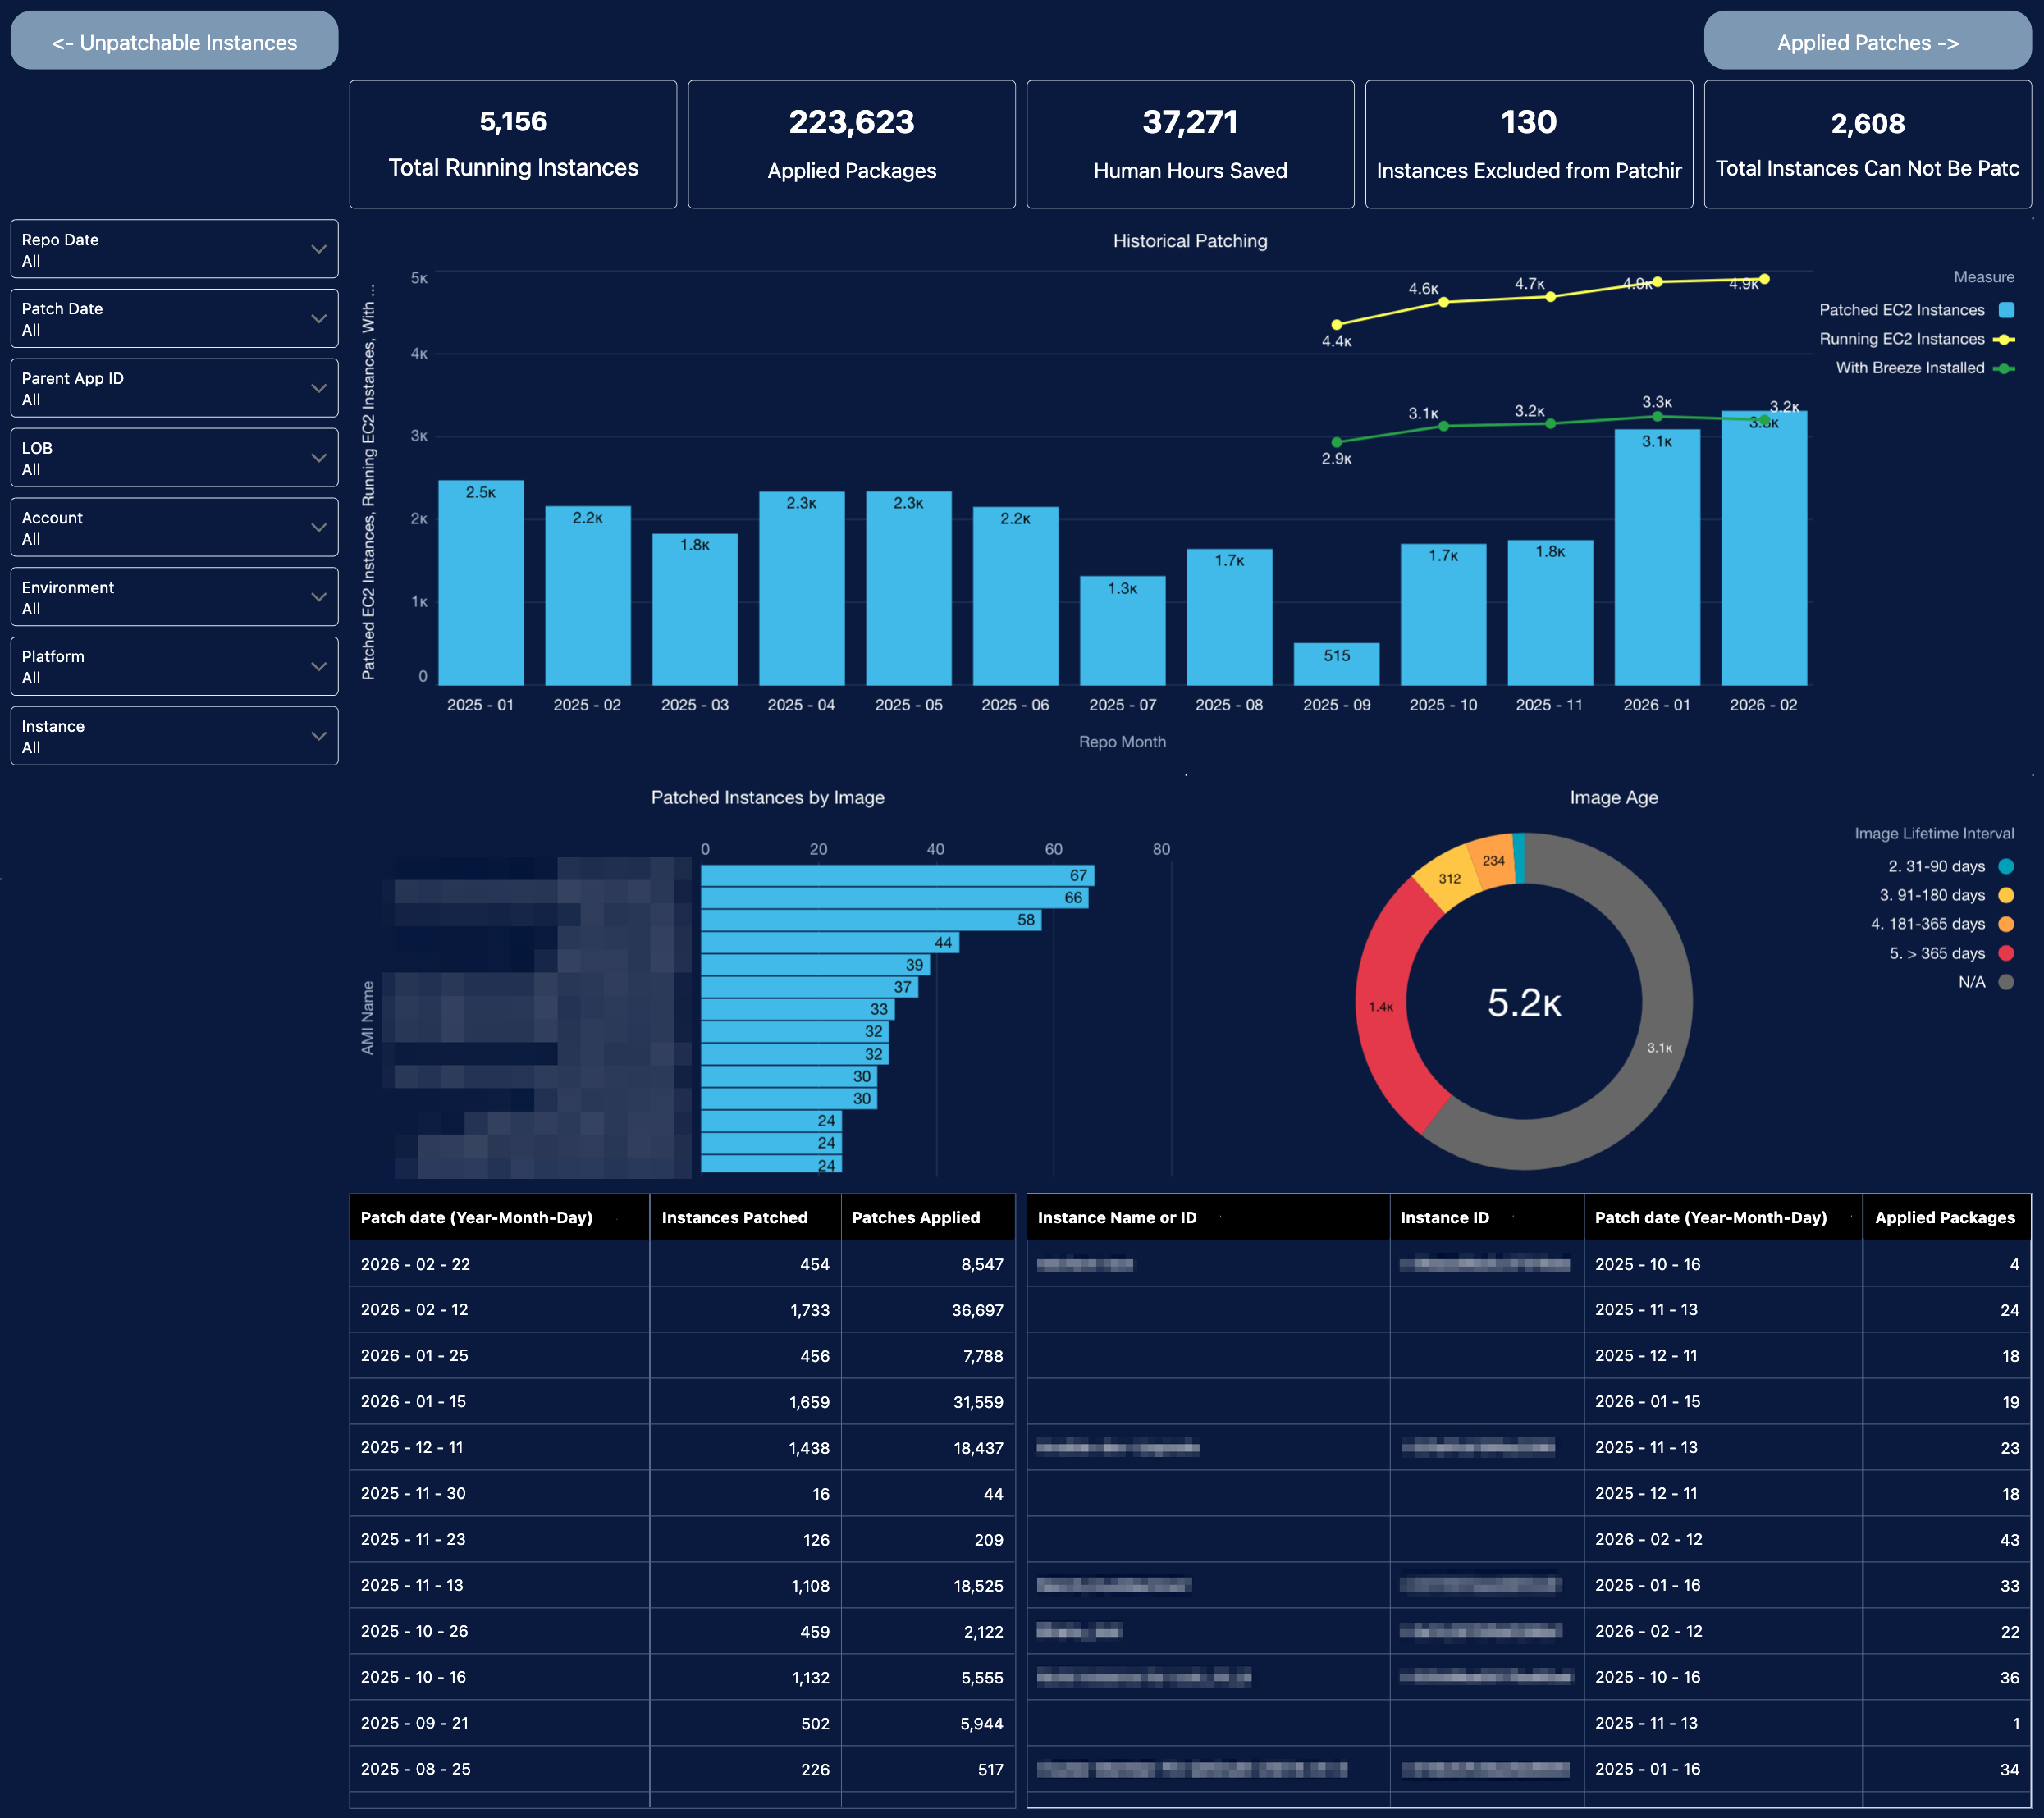
At the top, it provides headline metrics for the patching estate, including:
- Total running instances
- Total applied packages
- Estimated human hours saved
- Instances excluded from patching
- Instances that cannot be patched
These KPIs quickly convey the program's scale, the automation's impact, and how much of the environment remains outside normal patch coverage.
The central historical chart shows patching activity by month. The bars represent patched AWS EC2 instances, while the trend lines show the broader instance population, including running EC2 instances and systems with the Breeze agent installed. This helps users see patching volume over time, compare execution against fleet size, and identify months with reduced patch activity or stronger coverage.
The left-side filters allow users to segment the data by repo date, patch date, parent app ID, line of business, account, environment, platform, and instance. That makes the dashboard useful for both centralized operations teams and application owners who need to view results for their own scope.
The dashboard also has links to detailed dashboards:
- Applied Patches for teams to check:
- Total applied packages
- Reboot activity by month,
- Historical patch volume split by Dev, QA, Stage, Prod, and N/A,
- Detailed instance- and package-level patch records, including patch version, reboot occurrence, patch date, reason, and status.
- Unpatchable Instances for teams to view:
- running, patchable, and unpatchable instance counts;
- breakdown of exclusion reasons, such as ASG/EKS membership, inactive Breeze, end-of-life OS, low disk space, and exclusion by tag;
- distribution of unpatchable instances by value stream and environment;
- instance-level records with patching scope status, Breeze status, and OS support status.
For users, the value is the following:
- Visibility into patch execution. Users can see whether patching is actually happening, at what volume, and on which schedule.
- Coverage tracking. The dashboard shows how much of the estate is being patched vs. excluded or unpatchable, which is critical for risk assessment and audit readiness.
- Operational troubleshooting. Users can pinpoint gaps by environment, platform, account, or instance and investigate low-coverage areas or unusual patching trends.
- Program measurement. Metrics such as the number of applied packages and the human hours saved help demonstrate the business value of Cloudaware-managed patching.
- Decision support. By combining patch activity, exclusions, image age, and instance-level history, the dashboard helps teams prioritize remediation, refresh aging images, and validate rollout progress across Dev, Stage, and Prod.