Dashboards
Dashboards provide visual, at‑a‑glance views of compliance posture and remediation progress.
Common Dashboard Views
Organizations often build dashboards that show:
- Control pass rate – percentage of compliant vs. incompliant findings by benchmark, policy pack, or framework.
- Top failing controls – policies with the highest number of open violations, grouped by severity.
- Violations by environment or team – open findings by environment, business unit, application, or owner.
- Remediation velocity – how many violations are being closed over time.
- Exception landscape – active exceptions by policy, owner, and age.
Drill‑Downs
From high‑level tiles, dashboards can drill into:
- Specific accounts, subscriptions, or projects.
- Individual policies or benchmark sections.
- Lists of assets with the most violations.
This helps owners quickly move from posture summaries to concrete work.
Cloudaware Compliance Dashboards
Cloudaware provides compliance dashboards in Advanced Analytics. Here are examples:
Compliance Overview Dashboard
The dashboard shows overall cloud compliance posture, policy evaluation results, remediation performance, and the distribution of compliant and noncompliant checks across accounts, object types, and policy areas. It gives users both an executive summary of current compliance health and a drill-down view into where controls are failing, which resources are affected, and whether remediation is keeping pace.
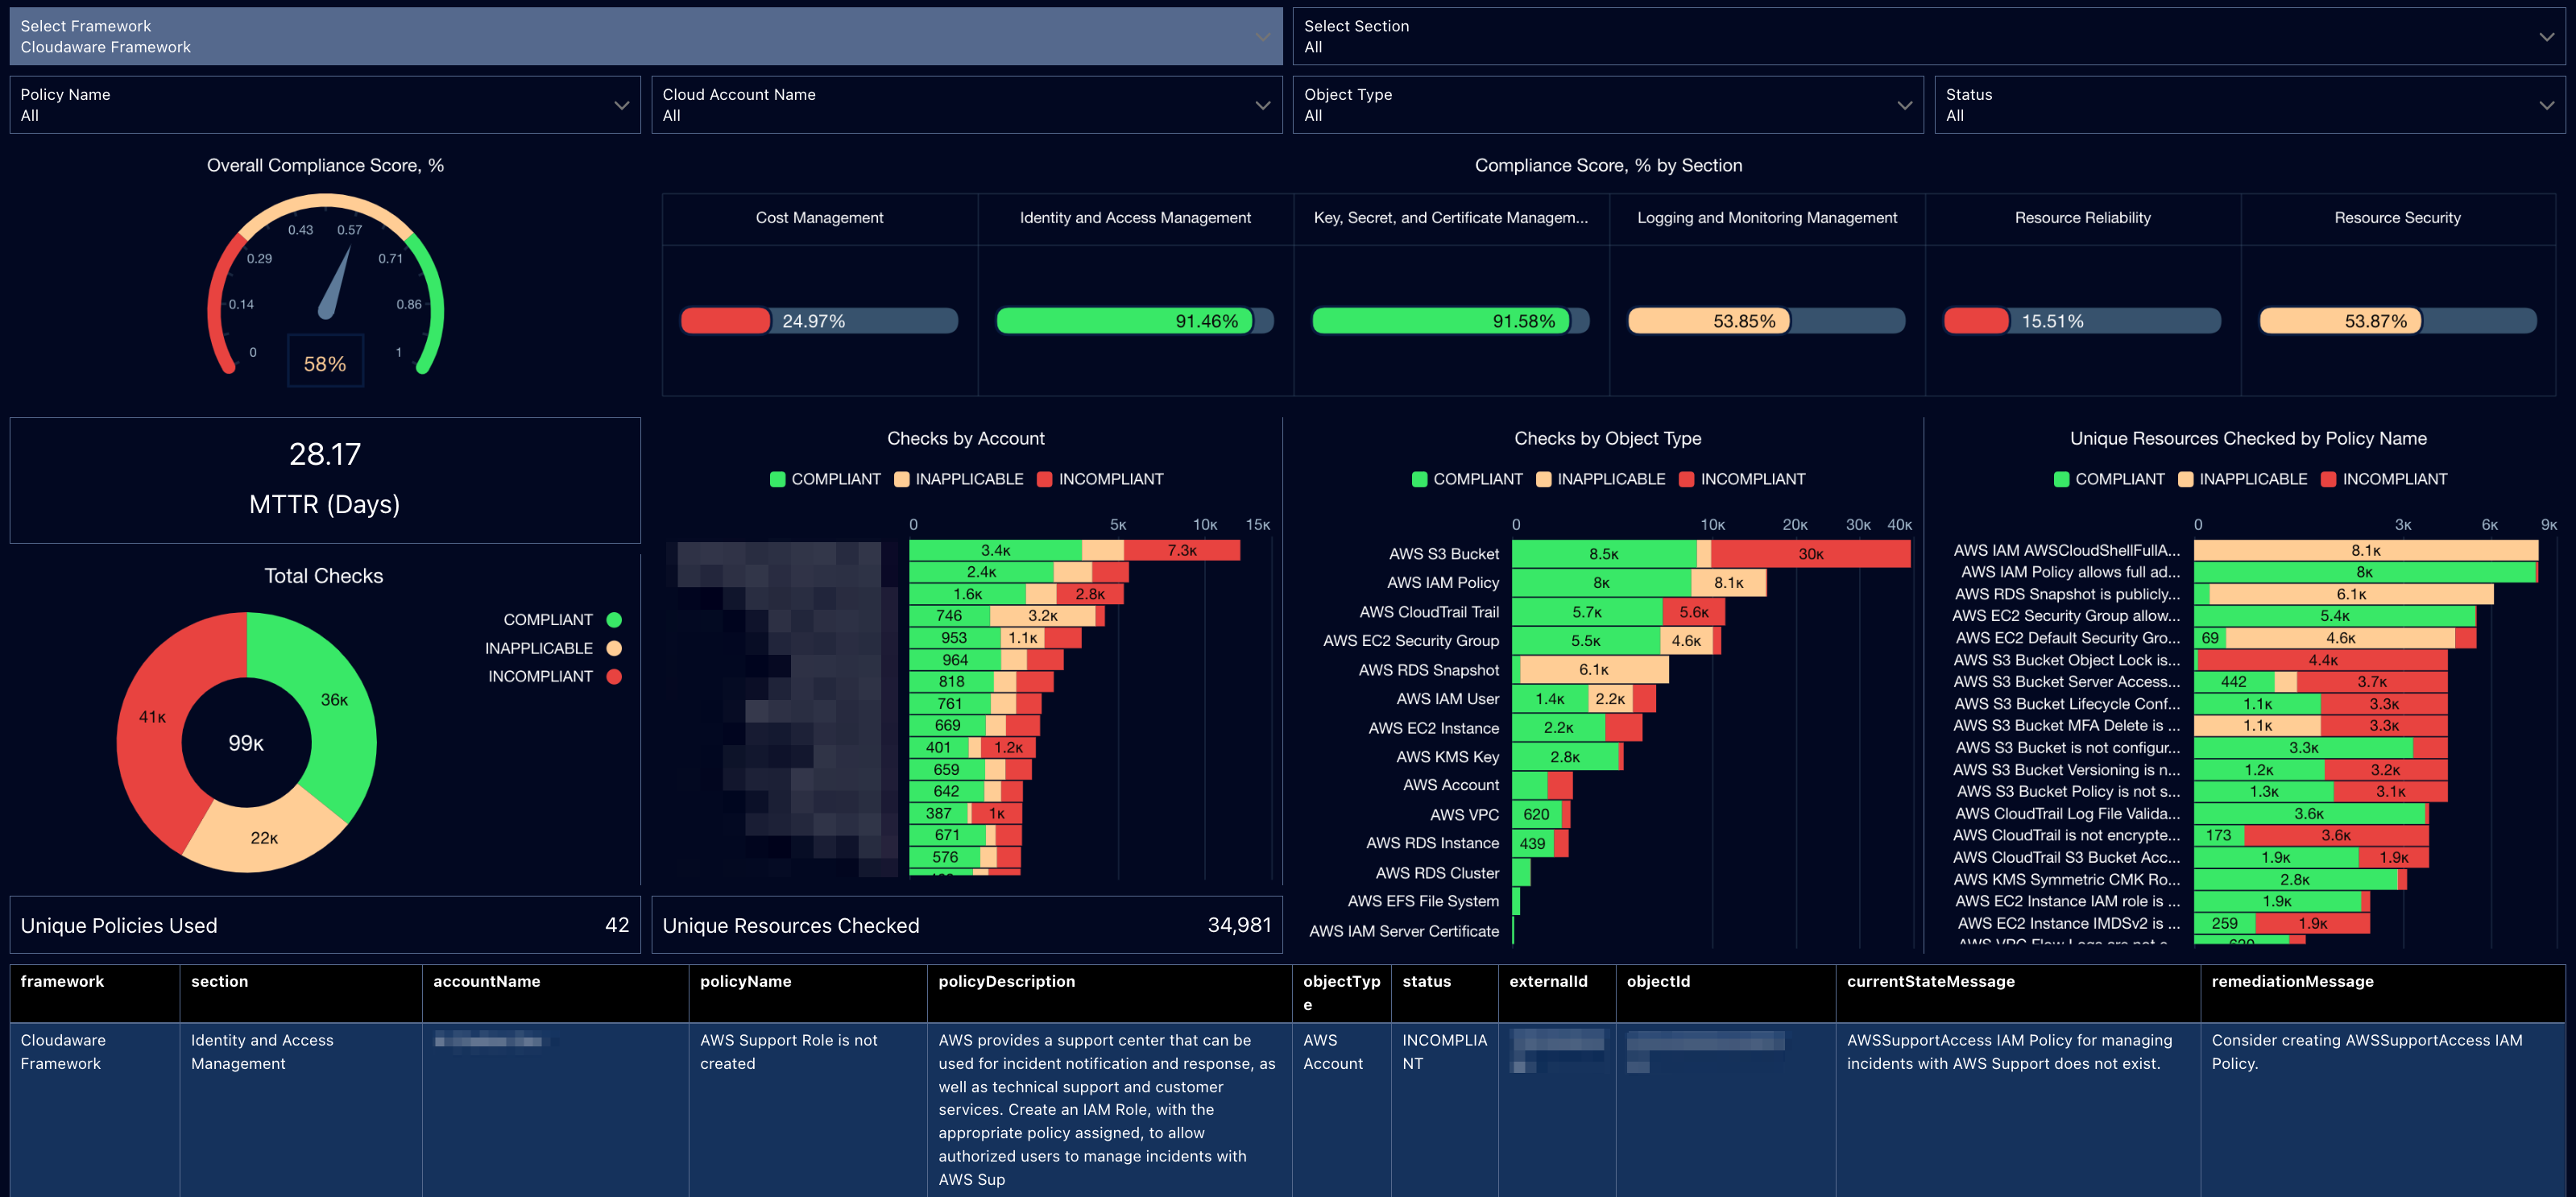
The top section is a filter bar that lets users slice the data by framework, section, policy name, cloud account name, object type, and status. That makes the dashboard usable across multiple compliance domains and cloud segments rather than as a single global view.
The main visual panels show:
- Overall Compliance Score, %: A gauge shows the overall percentage of checks passing for the selected framework and scope. This gives users a quick view of current posture and how far the environment is from the desired compliance target.
- Compliance Score, % by Section: A section-level scorecard shows compliance performance across major control domains such as cost management, identity and access management, key and secret management, logging and monitoring, resource reliability, and resource security. This helps users identify which control areas are strongest and which require the most attention.
- MTTR (Days): A KPI tile shows mean time to remediate compliance issues. This helps users understand how quickly findings are being resolved and whether remediation processes are effective.
- Total Checks: A donut chart shows the total number of checks split by compliant, inapplicable, and incompliant status. This helps users understand the overall composition of policy results and distinguish true failures from controls that do not apply.
- Checks by Account: A stacked bar chart shows the number of compliant, inapplicable, and incompliant checks by cloud account. This helps users identify where compliance issues are concentrated and which accounts may need focused remediation.
- Checks by Object Type: A ranked chart shows the distribution of check results across resource types such as S3 buckets, VPCs, KMS keys, IAM users, IAM policies, EC2 security groups, and EC2 instances. This helps users see which object classes are generating the most policy failures.
- Unique Resources Checked by Policy Name: A policy-level chart shows how many unique resources are evaluated under each policy and how many are compliant or incompliant. This highlights which policies are driving the most operational impact.
- Detailed Findings Table: A detailed table lists framework, section, cloud account name, policy name, policy description, object type, status, resource ID, current state message, and remediation message. This gives users the operational detail needed to investigate findings and act on remediation guidance.
For users, the value is in the following areas:
- Visibility into compliance posture. Users can see the overall compliance score, the volume of failed checks, and how posture varies across control sections.
- Section-based prioritization. By breaking results into policy domains such as IAM, logging, security, and reliability, the dashboard helps teams focus remediation where control weakness is greatest.
- Account and resource-level targeting. The breakdown by cloud account and object type helps users pinpoint where noncompliance is concentrated and assign ownership more effectively.
- Remediation performance tracking. MTTR provides a measurable view of how quickly teams respond to compliance issues, supporting operational accountability and audit readiness.
- Policy impact analysis. The policy-level view shows which controls affect the most resources, helping teams understand where remediation work will have the largest effect.
- Actionable investigation and follow-up. Filters by framework, section, account, object type, and status let users isolate relevant findings, review current state details, and use remediation guidance to drive corrective action.
Tagging Coverage and Compliance Dashboard
The dashboard shows overall tagging compliance in AWS, required tag coverage, and metadata quality across cloud resources. It gives users both an executive summary of tagging health and a drill-down view into where required tags are missing, which resource types are least compliant, and which accounts or organizational units need remediation.
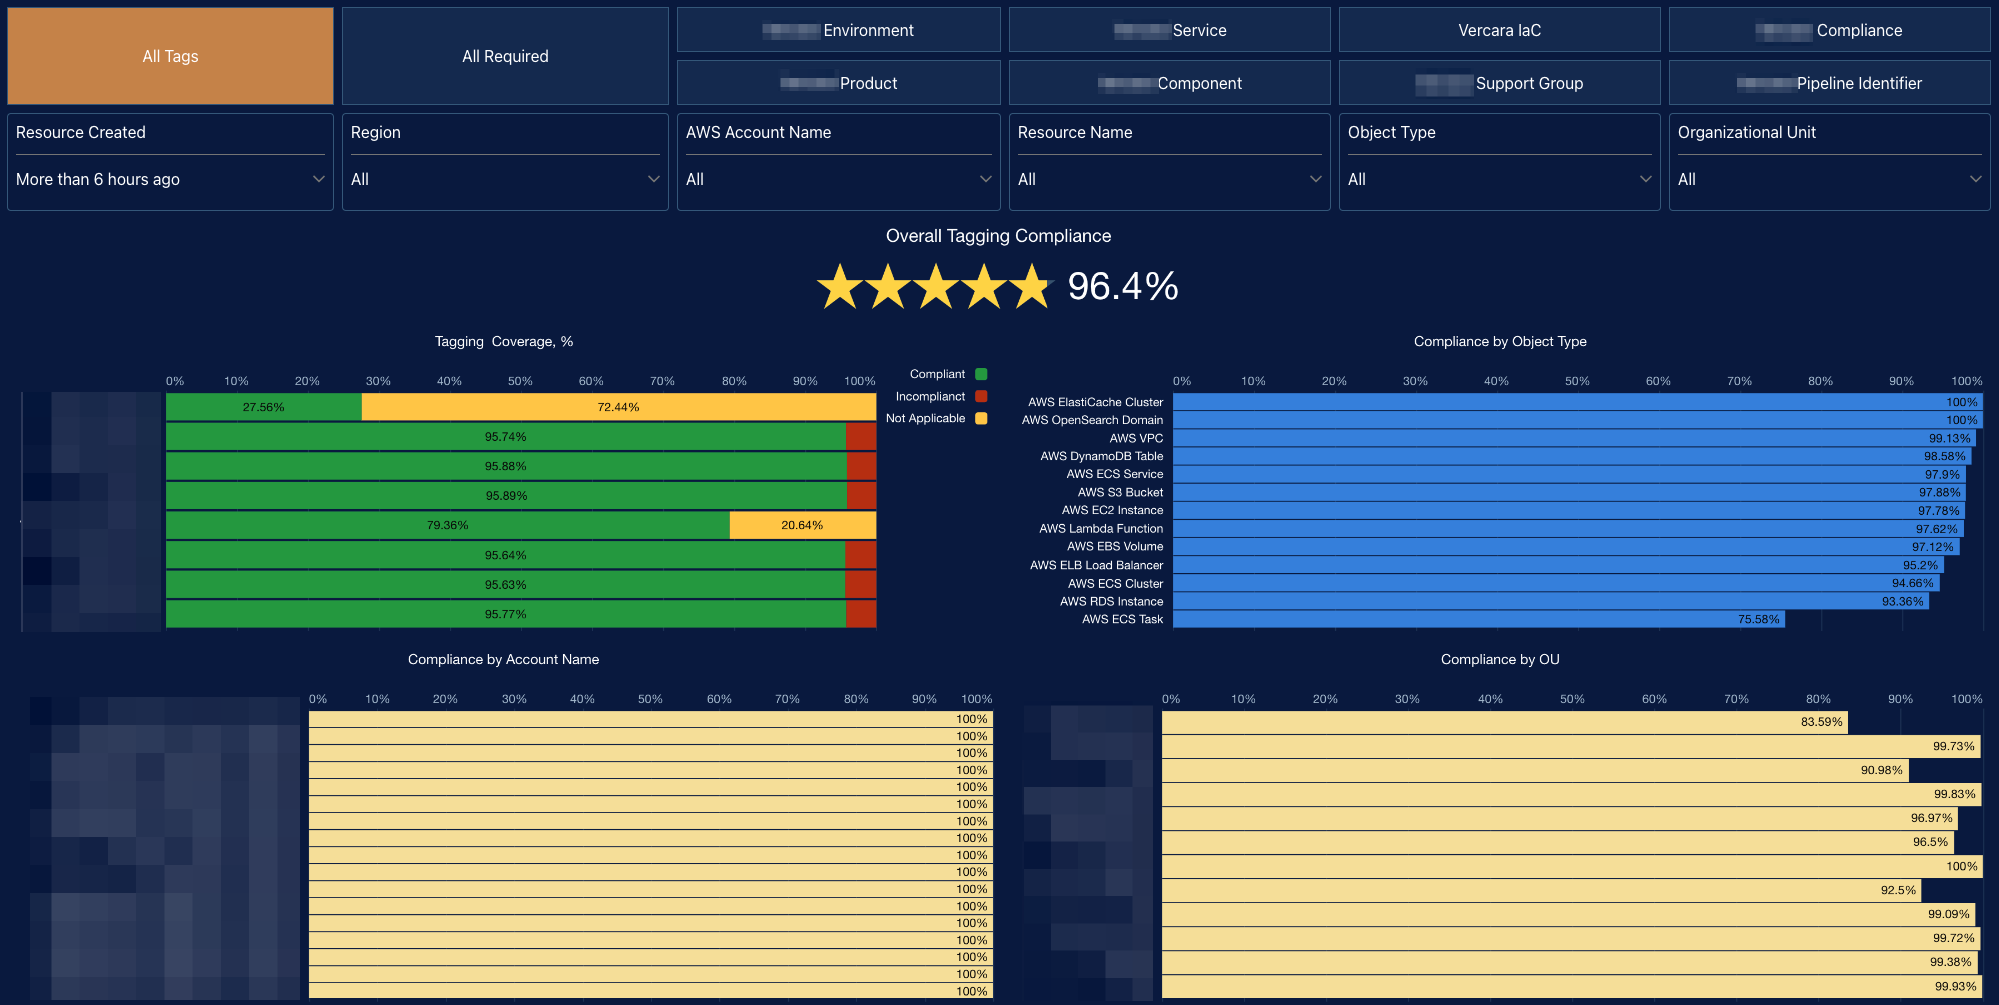
The top section is a filter bar that lets users slice the data by tag scope, required tag categories, resource age, region, AWS Account name, resource name, object type, and organizational unit. It also allows users to focus on specific required tag dimensions such as environment, service, product, support group, and others. That makes the dashboard usable across multiple governance, operational, and business contexts rather than as a single global view.
The main visual panels show:
- Overall Tagging Compliance: A headline metric shows the overall percentage of resources meeting the defined tagging policy. This gives users an immediate understanding of current tagging health across the selected scope.
- Tagging Coverage, %: A stacked horizontal bar chart shows the proportion of resources that are compliant, incompliant, or not applicable for the selected tagging dimensions. This helps users distinguish between true policy violations and resources that are exempt from the tagging requirement.
- Compliance by Object Type: A ranked bar chart shows tagging compliance across AWS resource types such as S3 buckets, EC2 instances, Lambda functions, VPCs, RDS instances, ECS services, and other cloud objects. This helps users identify which resource classes are most affected by missing metadata.
- Compliance by Account Name: A comparison chart shows tagging compliance across AWS accounts. This makes it easier to identify which accounts are consistently meeting the tagging standard and which ones require governance follow-up.
- Compliance by OU: A bar chart shows tagging compliance by organizational unit. This helps leadership and governance teams understand whether tagging discipline is consistent across organizational structures or concentrated in a few stronger or weaker areas.
For users, the value is in the following areas:
- Visibility into tagging compliance. Users can see what percentage of resources meet required tagging standards and where compliance gaps are concentrated.
- Governance and policy enforcement. The dashboard helps teams measure adherence to tagging requirements and identify where remediation is needed to improve policy compliance.
- Improved cost allocation and ownership mapping. Consistent tagging supports showback, chargeback, service ownership, and application-level cost transparency, and this dashboard highlights where those capabilities may be weakened by missing metadata.
- Operational and automation readiness. Required tags often support automation, support routing, lifecycle management, and control enforcement. The dashboard helps teams identify where missing tags could affect those downstream processes.
- Targeted remediation. By breaking compliance down by account, resource type, and organizational unit, the dashboard helps users focus cleanup efforts on the teams and resource groups with the largest gaps.
- Early detection of tagging issues. Filters on recently created resources allow users to catch noncompliant assets soon after creation, reducing long-term governance drift.